Author Archives: Kirk Borne

About Kirk Borne

Dr. Kirk D. Borne is a transdisciplinary Data Scientist and Professor of Astrophysics & Computational Science at George Mason University (since 2003). He conducts research, teaching, and doctoral student advising in the theory and practice of data science. He is also an active consultant to numerous organizations in data science and big data analytics across a wide variety disciplines, domains, and sectors. He previously spent nearly 20 years supporting large scientific data systems for NASA astrophysics missions, including the Hubble Space Telescope. He was identified in 2013 as the Worldwide #1 Big Data influencer on Twitter at @KirkDBorne. ​

Machine Unlearning and The Value of Imperfect Models

Common wisdom states that “perfect is the enemy of good enough.” We can apply this wisdom to the machine learning models that we train and deploy for big data analytics. If we strive for perfection, then we may encounter several potential risks. It may be useful therefore to pay attention to a little bit of “machine unlearning.” For example:

Overfitting

By attempting to build a model that correctly follows every little nuance, deviation, and variation in our data set, we are consequently almost certainly fitting the natural variance in the data, which will never go away.  After building such a model, we may find that it has nearly 100% accuracy on the training data, but significantly lower accuracy on the test data set.  These test results are guaranteed proof that we have overfit our model. Of course, we don’t want a trivial model (an underfit model) either – to paraphrase Albert Einstein: “models should be as simple as possible, but no simpler.”

(continue reading herehttps://www.mapr.com/blog/machine-unlearning-value-imperfect-models)

Follow Kirk Borne on Twitter @KirkDBorne

Kurtosis: Four Momentous Uses of A Statistical Orphan in the Era of Big Data

We frequently see much use of and commentary on the mean, medians, and modes of statistical distributions, as well as lengthy discussions of variance and skew (including the now famous “long tail“). But, what about fat tails? Is that a taboo subject? Maybe it is! For example, in the widely respected book Numerical Recipes: The Art of Scientific Computing, the authors had the audacity to say “the skewness (or third moment) and the kurtosis (or fourth moment) should be used with caution or, better yet, not at all.” Those warnings notwithstanding, kurtosis is making a comeback. Not that it ever went away, but a recent search on Google Scholar found over 3000 articles mentioning kurtosis in the context of statistics within the first three months of 2014, and over 12,000 articles in 2013, though only about 4000 such articles were cited in the preceding three years combined. Many of those contributions focus on real-world uses of that particular characteristic of data distributions.

So, what is kurtosis and what applications can we find for it in the Big Data world of Data Science?

(continue reading herehttp://www.statisticsviews.com/details/feature/6047711/Kurtosis-Four-Momentous-Uses-for-the-Fourth-Moment-of-Statistical-Distributions.html)

Follow Kirk Borne on Twitter @KirkDBorne

Outlier Detection Gets a New Look – Surprise Discovery in Big Data

Novelty and surprise are two of the more exciting aspects of science – finding something totally new and unexpected can lead to a quick research paper, or it can make your career. As scientists, we all yearn to make a significant discovery. Petascale big data collections potentially offer a multitude of such opportunities. But how do we find that unexpected thing? These discoveries come under various names: interestingness, outlier, novelty, anomaly, surprise, or defect (depending on the application). Outlier? Anomaly? Defect? How did they get onto this list? Well, those features are often the unexpected, interesting, novel, and surprising aspects (patterns, points, trends, and/or associations) in the data collection. Outliers, anomalies, and defects might be insignificant statistical deviants, or else they could represent significant scientific discoveries.

(continue reading herehttp://stats.cwslive.wiley.com/details/feature/6597751/Outlier-Detection-Gets-a-Makeover—Surprise-Discovery-in-Scientific-Big-Data.html)

Follow Kirk Borne on Twitter @KirkDBorne

The Power of Three: Big Data, Hadoop, and Finance Analytics

Big data is a universal phenomenon. Every business sector and aspect of society is being touched by the expanding flood of information from sensors, social networks, and streaming data sources. The financial sector is riding this wave as well. We examine here some of the features and benefits of Hadoop (and its family of tools and services) that enable large-scale data processing in finance (and consequently in nearly every other sector).

Three of the greatest benefits of big data are discovery, improved decision support, and greater return on innovation. In the world of finance, these also represent critical business functions….

(continue reading here:  https://www.mapr.com/blog/potent-trio-big-data-hadoop-and-finance-analytics)

Follow Kirk Borne on Twitter @KirkDBorne

Numbers are Powerful, Especially in Combination

The phrase “Big Data” refers to a set of serious analytical challenges that arise when the data increase in quantity, real-time speed, and complexity.  The three V’s of big data (Volume, Velocity, and Variety) are now well known and well worn. Their familiarity and frequent association with “big data hype” may numb us to the important data challenges that they are meant to represent. These three characterizations have their counterparts in tools and technologies.  For example, Hadoop (Apache’s open source implementation of the MapReduce programming model) is the technology du jour for management and analysis of high-volume data.  The Hadoop Distributed File System (HDFS) is the file system for big data storage and access in Hadoop clusters.  Apache Spark is a computing framework (built on HDFS) for fast processing of high-velocity data.

But, what about high-variety data?  The storage and management challenges of such data are already addressed (see above), but the real challenge is in performing effective and efficient statistical modeling, data mining, and discovery across high-dimensional (complex) data sets.  Software tools like Soft10 Inc.‘s “automatic statistician” Dr. Mo are designed to address that specific challenge.

When considering complex (high-variety) data, it is important to note that even relatively small-volume data sets can pose huge challenges to modeling, mining, and analysis algorithms and tools. For example, consider a gigabyte data table with a billion entries. If those entries correspond to 500 million rows and 2 columns, then some relatively simple “textbook” techniques can be applied: e.g., correlation analysis, regression analysis, Naïve Bayes, etc. However, if those entries correspond to one million rows and 1000 columns, then the complexity of the data analysis explodes exponentially.

It is not hard to find data sets that are at least this complex, if not much worse.  For example, the human genome consists of 3 billion base pairs (of just four bases: A, C, G, T) – the number of possible sequences of length 3 billion that can be formed from just four items is 4 to the power of 3 billion (limited of course by various genetic constraints). Another example will be the astronomical database to be obtained in the 10-year survey of the sky by the Large Synoptic Survey Telescope (lsst.org) – the final source table will consist of approximately 20 trillion rows and over 200 columns of scientific information per source.  Analyses of all possible combinations of these scientific parameters (to discover new correlations, patterns, associations, clusters, etc.) would be prohibitive.

The combinatorial theorem in mathematics tells us that there are (2^N – 1) possible combinations of N things. For example, a statistical analysis of a data table with just 3 columns (A,B,C) would require 7 distinct analyses (statistical models) of the behavior of the data: A, B, C, A with B, B with C, A with C, and with all three taken at once.  A data table with 5 columns would require 31 distinct analyses; and a table with 25 columns would require over 33 million distinct analyses. My calculator tells me that the number of distinct combinations of 200 variables is greater than 10^60.  This extraordinarily rapid growth rate is called the “combinatorial explosion”.  While no software package could ever perform that many variations of high-dimensional data analysis, it is common to focus on joint combinations of fewer parameters.  Even pairs, triples, and similar small-number combinations can have significant correlation and covariance, consequently yielding important discoveries.

Therefore, in order to meet the challenge of big data complexity (high variety), fast modeling technology is needed.  Such tools provide big benefits to both statisticians and non-statisticians.  These benefits multiply favorably when the technology can automatically build and test a large number of models (different combinations of parameters) in parallel.  Furthermore, the power of the technology is even more enhanced when it ranks the output models and parameter selection in order of significance and correlation strength.  Soft10’s “automatic statistician” Dr. Mo does these things and more. Dr. Mo models complex high-dimensional data both row-wise and column-wise. Dr. Mo produces high-accuracy predictions.  Dr. Mo’s proprietary multi-model technology is a powerful tool for predictive modeling and analytics across many application domains, including medicine and health, finance, customer analytics, target marketing, nonprofits, membership services, and more. Check out Dr. Mo at http://soft10ware.com/ and read more herehttp://soft10ware.com/big-data-complexity-requires-fast-modeling-technology/

Kirk Borne is a member of the Soft10, Inc. Board of Advisors.

Follow Kirk Borne on Twitter @KirkDBorne

IBM Insight 2014 – Day 2: The “One Thing” – Watson Analytics

The highlight of Day 2 at IBM Insight 2014 was the presentation of numerous examples, new features, powerful capabilities, and strategic vision for Watson Analytics.  This was the “one thing” – (to borrow the phrase from the movie “City Slickers”) – the one thing that seems to matter the most, that will make the biggest impact, and that has captured the essence of big data and analytics technologies for the future, rapidly approaching world of data everywhere, sensors everywhere, and the Internet of Things.

(continue reading more about Watson Analytics here:  http://ibm.co/10zEl6S)

Follow Kirk Borne on Twitter @KirkDBorne

IBM Insight 2014 – Day 1 Soundbites: Carpe Datum

There are big data meetups, workshops, conferences, and symposia. And then… there is IBM Insight 2014! There’s only one word to describe this happenin’ event: “Wow!”

The content of the event is focused on IBM’s products, services, corporate strengths, and partnerships. But the theme and message is laser-focused on the light-speed transformation of business in 2014 that has been achieved through insights from big data and analytics. From the Day 1 opening laser light show and film clip that featured DataKind founder Jake Porway along with Sensemaking evangelist Jeff Jonas, to their spectacular well timed entrance into the packed 12,000-seat Mandalay Bay Arena, continuing into a vast array of workshops and hands-on labs, the first day of Insight 2014 has been like a rapid tour through multiple parallel “Alice in Wonderland” universes.

If you are not able to attend the event, you can watch at InsightGO. You can also watch participant interviews on TheCube from SiliconANGLE and Wikibon: http://siliconangle.tv/ibm-insight-2014/

Ideas and insights have filled the arena and convention center in every conversation. Attached below are some of the soundbites (harvested from presentations and conversations).

What are people talking about at IBM Insight 2014?

  • Analytics take big data from information to insights to innovation.
  • The new data-driven business is built around “Systems of Insight” that inform every decision, interaction, and process.
  • Systems of Insight involve more people, more places, and more data.
  • Big data analytics drive business integration, intelligence, and innovation.
  • Watson Analytics reinvents the analytics experience in the cloud — its brilliant human-computer interface gives a whole new meaning to “human factors engineering”.
  • Cognitive Analytics with Watson generates (in real-time) the questions that you should be asking your data, through natural language dialogue, guided discovery, and fully automated intelligence.
  • IBM has released a suite a new services for big data and analytics, including Watson Curator, DataWorks, DashDB, and Cloudant.
  • The new quest for business is personalized engagement that incorporates immersive user experiences: fusing the physical world with digital interactions of all kinds.
  • In the era of digital marketing and real-time customer analytics, battles are won or lost in minutes (or even seconds).
  • A paradox in digital marketing has emerged:  outward-facing customer-centric analytics (personalization, segment of one) have forced organizations into more inward focus on big data operations.  We believe that this paradox evaporates when we realize that the focus on operations is in response to the urgent need to focus on the customer, at the right time, with the right offer, at the right place, in the right context.  That’s the 360 view, and that’s cognitive analytics at its best!
  • Fast data (big data velocity) is fast becoming the number 1 challenge, source of innovation, and revenue-generator for business.  Big data volume is so “2012”, and big data variety is so “2013” (though I personally think that we have yet to see the real power and revolution in data-driven business discovery through high-variety data, particularly via fast complex streaming data emanating from multiple sensors, sources,  and signals).
  • The real “big data analytics” talent shortage is in finding folks who know both the analytics (data science) and the business.
  • The Chief Data Officer is an agent for business transformation and change in the big data era.
  • IBM Insight might just be the 2014 World Series of Big Data Analytics.
  • Perhaps the real insight at IBM Insight 2014 is that what you really need to do is “to dress for success” with the right T-shirt …:

B0-OViwCMAAWnPj(Caption: Kirk Borne, Cortnie Abercrombie, and Jake Porway sharing a moment)

  • Carpe datum!

Follow Kirk Borne on Twitter @KirkDBorne


Chief Data Officer as Business Change Agent

Deriving business value from, leveraging, protecting, and promoting an organization’s rapidly growing data assets are now coming under the corporate executive sponsorship of a new member of the executive suite – the CDO (Chief Data Officer).  This role should be considered as distinctly different from other similarly defined roles: (a) the CIO, whose responsibilities now revolve primarily around information technologies and information security; (b) the CDS (Chief Data Scientist), whose role is evolving, but should be primarily that of Chief Scientist, specifically related to Data Science, exploring new business models and discoverying insights from the data resources; and (c) the CAO (Chief Analytics Officer), whose role is also evolving and who may be roughly equivalent to the CDS, though the CAO’s focus should be more on mapping the data science capabilities (championed by the CDS) and the data assets (sponsored by the CDO) onto the data-to-decisions, data-to-discovery, and data-to-insights goals of the line of business.

We also see a lot of overlap in this set of roles with those of the CMO (Chief Marketing Officer) and the Chief Innovation Strategy Officer.  We are not suggesting that each and every business will need all of these, but the organization should identify what their corporate strategy and business goals require, and then create the roles that will drive change in those directions.

In this evolving leadership landscape within the growing Big Data era, the CDO is definitely creating a lot of buzz.  Since Big Data and Analytics are now listed as the top drivers of innovation, revenue, and change within organizations, then the CDO should be there to drive that change.  Here are two sources of case studies and information regarding the CDO:

(1) See the new IBM Chief Data Officer website at http://ibm.com/services/c-suite/cdo. Related to this effort, see also the Institute for Business Value within IBM’s Center for Applied Insights. For further insights, listen to Cortnie Abercrombie of IBM as she provides further insights and recommendations for the CDO role in her online interviews: here and here!

(2) Download the Innovation Enterprise’s white paper Rise of the Chief Data Officer – An Executive Whose Time Has Come“, by George Hill and Chris Towers.  I was fortunate to write the Foreward for this booklet.  Here is an excerpt from my Foreward:

Many now believe that Big Data has matured, moving beyond the peak of its initial hype and is moving ahead into its promised plateau of productivity. Data has come of age in the corporate boardroom as well.  The enormous potential for new wealth, new products, new customers, new insights, and new entrepreneurial business lines has caused a cataclysmic shift in the power of “information” in the corporate executive suite. The existing CIO’s role seems to have solidified in the past decade to that of “Chief Information Technology Officer,” with an emphasis primarily on technology and infrastructure.  The new CxO in the boardroom is the data person (the “data lover”). This may be the Chief Data Scientist (focused on the analytics objectives, opportunities, and obsessions that arise in this era of Big Data).  But, we also see the CDO (Chief Data Officer) coming into the inner circle of executive power.

The CDO is focused on the data – acquisition, governance, quality, management, integration, policies (including privacy, preservation, deduplication, curation), value creation, recruiting skilled data professionals, establishing a data-driven corporate culture, team-building around data-centric business objectives, and acquisition and oversight of corporate data technologies (not I.T. in the historical sense). The responsibilities are enormous, the requisite skills are CxO-worthy, the challenges are many, and the opportunities to create and define the role are very attractive.

(continue reading here http://ie.theinnovationenterprise.com/event_justify_your_rois/Rise-of-the-Chief-Data-Officer.pdf)

Follow Kirk Borne on Twitter @KirkDBorne
IBM Insight 2014 – The Big Data World Series (or something like that)

I am attending the IBM Insight 2014 conference this year, along with many(!) other big data analytics luminaries, including Jake Porway (@jakeporway, of Data Kind), James Kobielus (@jameskobielus, the IBM Big Data Evangelist — I love that title!), Carla Gentry (@data_nerd, of Analytical Solution), Lillian Pierson (@BigDataGal, data journalist and author of the new book “Data Science for Dummies“), and thousands (maybe millions) more!

There are many new developments happening in 2014 across the big data universe that will be discussed at #IBMinsight.  These include cloud-based analytics, cognitive analytics, Big SQL, the Internet of Things, machine-to-machine analytics, real-time actionable insights from data, content-based customer experience management, and predictive everything (e.g., customer intelligence; manufacturing; biomedical conditions; etc.). This is the place to be right now in order to learn about these rapidly evolving advancements.

For the twitter crowd, you can follow and  jump into one of the Insight Tweet Chats from anywhere in the world.  For example, join the discussion on Sunday October 26 at 11:00pm (New York time):  https://www.crowdchat.net/IBMInsight

Even if you cannot be in Las Vegas(**) for this great event (perhaps “The 2014 World Series of Big Data”), you can still watch the presentations online and learn all about the latest Big Data Analytics and Data Science insights via “Insight GO“. The IBM InsightGo site describes it like this:

InsightGO is IBM’s interactive digital platform, streaming live broadcasts straight to your laptop or mobile device. It’s the next best thing to being in Vegas.

InsightGO is specially designed for both offsite and onsite attendees and features:

InsightGO will be hosted by writer, gamer and video star Veronica Belmont.

InsightGO registration is complimentary.

(**) What happens in Vegas stays in my Twitter timeline!

insight2014-940x219


Follow Kirk Borne on Twitter @KirkDBorne

When Big Data Goes Local, Small Data Gets Big

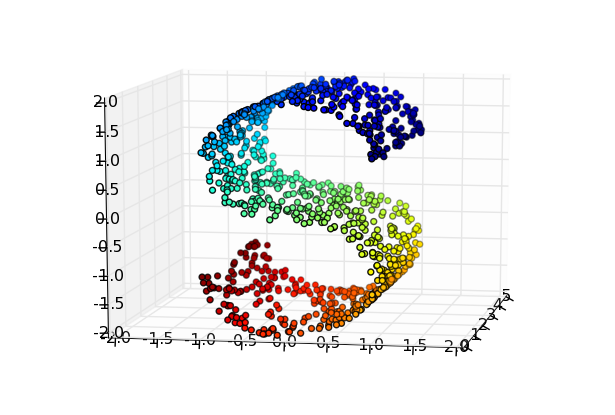
This two-part series focuses on the value of doing small data analyses on a big data collection.  In Part 1 of the series, we describe the applications and benefits of “small data” in general terms from several different perspectives.  In Part 2 of the series, we’ll spend some quality time with one specific algorithm (Local Linear Embedding) that enables local subsets of data (i.e., small data) to be used in developing a global understanding of the full big data collection.

We often hear that small data deserves at least as much attention in our analyses as big data.  While there may be as many interpretations of that statement as there are definitions of big data (and see more here), there are at least two situations where “small data” applications are worth considering…

(continue reading here https://www.mapr.com/blog/when-big-data-goes-local-small-data-gets-big-part-1)

Local Linear Embedding

Follow Kirk Borne on Twitter @KirkDBorne