Tag Archives: Data Science

Three Types of Actionable Business Analytics Not Called Predictive or Prescriptive

Decades (at least) of business analytics writings have focused on the power, perspicacity, value, and validity in deploying predictive and prescriptive analytics for business forecasting and optimization, respectively. These are primarily forward-looking actionable (proactive) applications. 

There are other dimensions of analytics that tend to focus on hindsight for business reporting and causal analysis – these are descriptive and diagnostic analytics, respectively, which are primarily reactive applications, mostly explanatory and investigatory, not necessarily actionable.

In the world of data there are other types of nuanced applications of business analytics that are also actionable – perhaps these are not too different from predictive and prescriptive, but their significance, value, and implementation can be explained and justified differently. Before we dive into these additional types of analytics applications, let us first consider a little pedagogical exercise with two simple evidence-based inferences.

(a) In essentially 100% of cases where an automobile is involved in an accident, the automobile had four wheels on the car prior to the accident.

(b) In 100% of divorce cases, the divorcing couple was married prior to the divorce.

What is the point of those obvious statistical inferences? The point is that the 100% association between the event and the preceding condition has no special predictive or prescriptive power. Hence, prior knowledge of these 100% associations does not offer any actionable value. In statistical terms, the joint probability of event Y and condition X co-occurring, designated P(X,Y), is essentially the probability P(Y) of event Y occurring. The probability of the condition X occurring, P(X), is irrelevant since the existence of the precondition X is implicitly present by default.

Okay, those examples represent two remarkably uninteresting cases. Even when similar sorts of inferences occur in a business context, they have essentially zero value. How do predictive and prescriptive analytics fit into this statistical framework?

Using the same statistical terminology, the conditional probability P(Y|X) (the probability of Y occurring, given the presence of precondition X) is an expression of predictive analytics. By exploring and analyzing the business data, analysts and data scientists can search for and uncover such predictive relationships. This is predictive power discovery. Another way of saying this is: given observed data X, we can predict some outcome Y. Or more simply: given X, find Y.

Similarly (actually, conversely), we can use the conditional probability P(X|Y) (which is the probability that the precondition X exists, given the existence of outcome Y) as an expression of prescriptive analytics. How does that work in practice? By exploring and analyzing business data, analysts and data scientists can search for and uncover the conditions (causal factors) that have led to different outcomes. So, if the business wants to optimize some outcome Y, then data analysts will be tasked with finding the conditions X that must be implemented to achieve that desired outcome. This is prescriptive power discovery. Another way of saying this is: given some desired optimal outcome Y, what conditions X should we put in place. Or more simply: given Y, find X. Note how this simple mathematical expression of prescriptive analytics is exactly the opposite of our previous expression of predictive analytics (given X, find Y).

Here are a few business examples of this type of prescriptive analytics: Which marketing campaign is most efficient and effective (has best ROI) in optimizing sales? Which environmental factors during manufacturing, packaging, or shipping lead to reduced product returns? Which pricing strategies lead to the best business revenue? What equipment maintenance schedule minimizes failures, downtime (mean time to recovery), and overall maintenance costs?

Now that we have described predictive and prescriptive analytics in detail, what is there left? What are the three types of actionable (and valuable) business analytics applications that are not called predictive or prescriptive? They are sentinel, precursor, and cognitive analytics. Let’s define what these are.

  1. Sentinel Analytics – in common usage, the sentinel is the person on the guard station who is charged with watching for significant incoming or emergent activity. In practice, all activity is being observed and a decision is made as to whether any particular activity requires some sort of triage: sounding an alarm, or sending an alert to decision-makers, or doing nothing.
    • In the enterprise, sentinel analytics is most timely and beneficial when applied to real-time, dynamic data streams and time-critical decisions. For example, sensors (including internet of things devices and APIs on data networks) can be deployed with logic (analytics, statistical, and/or machine learning algorithms) to monitor and “watch” business systems and processes for emerging patterns, trends, behaviors, unusual operating modes, and anomalies that might be indicators of activities that require business attention, decisions, and/or action. 
  2. Precursor Analytics – in common usage, precursors are the early-warning indicators (harbingers, forerunners) of something else more serious or catastrophic that is about to come. We occasionally hear about earthquake precursors (increased levels of radon in groundwater), tidal wave precursors (a deep ocean earthquake), and cyber-attack precursors (phishing incidents). Precursor analytics is related to sentinel analytics. The latter (sentinel) is associated primarily with “watching” the data for interesting patterns that might require action, while precursor analytics is associated primarily with training the business systems to quickly identify those specific “learned” patterns and events that are known to be associated with high-risk events, thus requiring timely attention, intervention, and remediation. 
    • In these applications, the data science involvement includes both the “learning” of the most significant patterns to alert on and the improvement of their models (logic) to minimize false positives and false negatives. The analytics triage is critical, to avoid alarm fatigue (sending too many unimportant alerts) and to avoid underreporting of important actionable events. One could say that sentinel analytics is more like unsupervised machine learning, while precursor analytics is more like supervised machine learning. That is not a totally clean separation and distinction, but it might help to clarify their different applications of data science. 
    • The counterexample to the supervised learning explanation of precursor analytics is a “black swan” event – a rare high-impact event that is difficult to predict under normal circumstances – such as the global pandemic, which led to the failure of many predictive models in business. Broken models are definitely disruptive to analytics applications and business operations. Paradoxically, the precursor was actually predictive in a disruptive anti-predictive sort of way, which brings us right back to P(Y|X), or maybe it should be stated as P(“not Y”|X) where X is the black swan event (i.e., the predicted outcome Y from existing models will not occur in this case). As such, the global pandemic serves as a warning (a harbinger of disruption) and consequently as a “training example” to businesses for any future black swans. 
  3. Cognitive Analytics – this analytics mindset approach focuses on “surprise” discovery in data, using machine learning and AI to emulate and automate the cognitive abilities of humans. The goal is to discover novel, interesting, unexpected, and potentially valuable signals in the flood of streaming enterprise data. These may not be high-risk discoveries, but they could be high-reward discoveries. How does that resemble human cognitive abilities? Curiosity! Being curious about seeing something “funny” that you didn’t expect, thereby putting a “marker” in the data stream: “Look here! Pay attention! Ask questions about this!” 
    • Cognitive analytics is basically the opposite of descriptive analytics. In descriptive analytics, the task is to find answers to predetermined business questions (how much, how many, how often, who, where, when), whereas cognitive analytics is tasked with finding the business questions that should be asked. Descriptive: find the right answers in the data. Cognitive: find the right questions in the data. Cognitive analytics can then be viewed as a precursor to diagnostic analytics, which is the investigative stage of analytics that answers the questions raised by cognitive analytics (“Why did this happen?”, “Why are we seeing this pattern in our data?”, “What is the business impact of this trend, anomaly, behavior?”, “What is our next-best action as a result of this?”, “That’s funny! What is that?”).

None of these descriptions of the 3 “new” analytics applications are meant to declare that these are completely distinct and different from the “big 4” analytics applications that we have known for many years (Descriptive, Diagnostic, Predictive, Prescriptive). But the differences between the “big 4” and the “new 3” are in the nuanced business applications of these analytics in the enterprise and in the types of inferences that the data scientists are asked to derive from the business data. 

Deploying these analytics in the cloud further expands their accessibility, democratization, enterprise-wide acceptance, broad advocacy, and ultimate business value. Blending automated analytics products (coming from the sentinel, precursor, and cognitive applications) with human-in-the-loop inquisitiveness, curiosity, creativity, out-of-the-box thinking, idea generation, and persistence can transform any organization into a data analytics powerhouse through an analytic culture revolution. This is more imperative than ever, as a global survey of analytics executives has revealed:

  • “Companies have been working to become more data-driven for many years, with mixed results.”
  • “Right now, the biggest challenge for organizations working on their data strategy might not have to do with technology at all.”
  • “Corporate chief data, information, and analytics executives reported that cultural change is the most critical business imperative.”
  • “Just 26.5% of organizations report having established a data-driven organization.”
  • “91.9% of executives cite cultural obstacles as the greatest barrier to becoming data driven.”
  • Reference: https://hbr.org/2022/02/why-becoming-a-data-driven-organization-is-so-hard

Where do organizations get help to overcome these challenges? Microsoft delivers what its clients need to help them grow their top line with cloud-based analytics. Microsoft’s cloud-based analytics products and services propel business insights, innovation, and value from enterprise data, with all of the dimensions of analytics applications brought into the game. Specifically, cloud analytics (accessing and inferencing on multiple diverse business datasets across business units) for a wide variety of enterprise applications can sharpen the workforce’s focus on value and growth, including: forward-looking insights through predictive, sentinel, and precursor analytics; novel recommendations; rich customer engagement; analytic product innovation; resilience through prescriptive analytics; surprise discovery in data, asking the right questions, and exploring the most insightful lines of inquiry through cognitive analytics; and more.

Microsoft Azure Cloud extends ease-of-access analytics to all, delivers increased speed to deployment, provides leading security, compliance, and governance – with price performance for any organization. Whether organizations are seeking scalability in their enterprise data systems, advanced analytics capabilities (including the “big 4” and the “new 3”), real-time analytics (essential value-drivers from streaming data, including IoT, network logs, online customer interactions, supply chain, etc.), and the best in machine learning model-building and deployment services, Microsoft Azure Cloud has you covered. To learn more about it, go to https://azure.microsoft.com/en-us/solutions/cloud-scale-analytics and bring actionable business analytics to higher levels of proficiency and productivity across your organization.

Three Emerging Analytics Products Derived from Value-driven Data Innovation and Insights Discovery in the Enterprise

I recently saw an informal online survey that asked users which types of data (tabular, text, images, or “other”) are being used in their organization’s analytics applications. This was not a scientific or statistically robust survey, so the results are not necessarily reliable, but they are interesting and provocative. The results showed that (among those surveyed) approximately 90% of enterprise analytics applications are being built on tabular data. The ease with which such structured data can be stored, understood, indexed, searched, accessed, and incorporated into business models could explain this high percentage. A similarly high percentage of tabular data usage among data scientists was mentioned here.

If my explanation above is the correct interpretation of the high percentage, and if the statement refers to successfully deployed applications (i.e., analytics products, in contrast to non-deployed training experiments, demos, and internal validations of the applications), then maybe we would not be surprised if a new survey (not yet conducted) was to reveal that a similar percentage of value-producing enterprise data innovation and analytics/ML/AI applications (hereafter, “analytics products”) are based on on-premises (on-prem) data sources. Why? … because the same productivity benefits mentioned above for tabular data sources (fast and easy data access) would also be applicable in these cases (on-prem data sources). And no one could deny that these benefits would be substantial. What could be faster and easier than on-prem enterprise data sources?

Accompanying the massive growth in sensor data (from ubiquitous IoT devices, including location-based and time-based streaming data), there have emerged some special analytics products that are growing in significance, especially in the context of innovation and insights discovery from on-prem enterprise data sources. These enterprise analytics products are related to traditional predictive and prescriptive analytics, but these emergent products may specifically require low-latency (on-prem) data delivery to support enterprise requirements for timely, low-latency analytics product delivery. These three emergent analytics products are:

(a) Sentinel Analytics – focused on monitoring (“keeping an eye on”) multiple enterprise systems and business processes, as part of an observability strategy for time-critical business insights discovery and value creation from enterprise data sources. For example, sensors can monitor and “watch” systems and processes for emergent trends, patterns, anomalies, behaviors, and early warning signs that require interventions. Monitoring of data sources can include online web usage actions, streaming IT system patterns, system-generated log files, customer behaviors, environmental (ESG) factors, energy usage, supply chain, logistics, social and news trends, and social media sentiment. Observability represents the business strategy behind the monitoring activities. The strategy addresses the “what, when, where, why, and how” questions from business leaders concerning the placement of “sensors” that are used to collect the essential data that power the sentinel analytics product, in order to generate timely insights and thereby enable better data-informed “just in time” business decisions.

(b) Precursor Analytics – the use of AI and machine learning to identify, evaluate, and generate critical early-warning alerts in enterprise systems and business processes, using high-variety data sources to minimize false alarms (i.e., using high-dimensional data feature space to disambiguate events that seem to be similar, but are not). Precursor analytics is related to sentinel analytics. The latter is associated primarily with “watching” the data for interesting patterns, while precursor analytics is associated primarily with training the business systems to quickly identify those specific patterns and events that could be associated with high-risk events, thus requiring timely attention, intervention, and remediation. One could say that sentinel analytics is more like unsupervised machine learning, while precursor analytics is more like supervised machine learning. That is not a totally clear separation and distinction, but it might help to clarify their different applications of data science. Data scientists work with business users to define and learn the rules by which precursor analytics models produce high-accuracy early warnings. For example, an exploration of historical data may reveal that an increase in customer satisfaction (or dissatisfaction) with one particular product is correlated with some other satisfaction (or dissatisfaction) metric downstream at a later date. Consequently, based on this learning, deploying a precursor analytics product to detect the initial trigger event early can thus enable a timely response to the situation, which can produce a positive business outcome and prevent an otherwise certain negative outcome.

(c) Cognitive Analytics – focused on “surprise” discovery in diverse data streams across numerous enterprise systems and business processes, using machine learning and data science to emulate and automate the curiosity and cognitive abilities of humans – enabling the discovery of novel, interesting, unexpected, and potentially business-relevant signals across all enterprise data streams. These may not be high risk. They might actually be high-reward discoveries. For example, in one company, an employee noticed that it was the customer’s birthday during their interaction and offered a small gift to the customer at that moment—a gift that was pre-authorized by upper management because they understood that their employees are customer-facing and they anticipated that their employees would need to have the authority to take such customer-pleasing actions “in the moment”. The outcome was very positive indeed, as this customer reported the delightful experience on their social media account, thereby spreading positive sentiment about the business to a wide audience. Instead of relying on employees to catch all surprises in the data streams, the enterprise analytics applications can be trained to automatically watch for, identify, and act on these surprises. In the customer birthday example, the cognitive analytics product can be set up for automated detection and response, which can occur without the employee in the loop at all, such as in a customer’s online shopping experience or in a chat with the customer call center bot.

These three analytics products are derived from business value-driven data innovation and insights discovery in the enterprise. Investigating and deploying these are a worthy strategic move for any organization that is swimming in a sea (or lake or ocean) of on-prem enterprise data sources.

In closing, let us look at some non-enterprise examples of these three types of analytics:

  • Sentinel – the sentinel on the guard station at a military post is charged with watching for incoming activity. They are assigned this duty just in case something occurs during the night or when everyone else is busy with other operational things. That “something” might be an enemy approaching or a wild bear in the forest. In either case, keeping an eye on the situation is critical for the success of the operation. Another example of a sentinel is a marked increase in the volatility of stock market prices, indicating that there may be a lot of FUD (fear, uncertainty, and doubt) in the market that could lead to wild swings or downturns. In fact, anytime that any streaming data monitoring metric shows higher than usual volatility, this may be an indicator that the monitored thing requires some attention, an investigation, and possibly an intervention.
  • Precursor – prior to large earthquakes, it has been found that increased levels of radon are detected in soil, in groundwater, and even in the air in people’s home basements. This precursor is presumed to be caused by the radon being released from cavities within the Earth’s crust as the crust is being strained prior to the sudden slippage (the earthquake). Earthquakes themselves can be precursors to serious events – specifically, a large earthquake detected at the bottom of the ocean can produce a massive tidal wave, that can travel across the ocean and have drastic consequences on distant shores. In some cases, the precursor can occur sufficiently in advance of the tidal wave’s predicted arrival at inhabited shores, thereby enabling early warnings to be broadcasted. In both of these cases, the precursor (radon release or ocean-based earthquake) is not the biggest problem, though they may be seen as sentinels of an on-going event, but the precursor is an early warning sign of a potentially bigger catastrophe that’s coming (a major land-based earthquake or a tidal wave hitting major population centers along coastlines, respectively).
  • Cognitive – a cognitive person walking into an intense group meeting (perhaps a family or board meeting) can probably tell the mood of the room fairly quickly. The signals are there, though mostly contextual, thus probably missed by a cognitively impaired person. A cognitive person is curious about odd things that they see and hear—things or circumstances or behaviors that seem out of context, unusual, and surprising. The thing itself (or the data about the thing) may not be surprising (though it could be), but the context (the “metadata”, which is “other data about the primary data”) provides a signal that something needs attention here. Perhaps the simplest expression of being cognitive in this data-drenched world comes from a quote attributed to famous science writer Isaac Asimov: “The most exciting phrase to hear in science, the one that heralds new discoveries, is not ‘Eureka!’ (I found it!) but ‘That’s funny…‘.”

The cognitive enterprise versus the cognitively impaired enterprise – which of these would your organization prefer to be? Get moving now with sentinel, precursor, and cognitive analytics through data innovation and insights discovery with your on-prem enterprise data sources.

Read more about analytics innovation from on-prem enterprise data sources in this 3-part blog series:

  1. Solving the Data Daze – Analytics at the Speed of Business Questions
  2. The Data Space-Time Continuum for Analytics Innovation and Business Growth
  3. Delivering Low-Latency Analytics Products for Business Success

Top 9 Considerations for Enterprise AI

Artificial intelligence (AI) is top of mind for executives, business leaders, investors, and most workplace employees everywhere. The impacts are expected to be large, deep, and wide across the enterprise, to have both short-term and long-term effects, to have significant potential to be a force both for good and for bad, and to be a continuing concern for all conscientious workers. In confronting these winds of change, enterprise leaders are faced with many new questions, decisions, and requirements – including the big question: are these winds of change helping us to move our organization forward (tailwinds) or are they sources of friction in our organization (headwinds)?

The current AI atmosphere in enterprises reminds us of the internet’s first big entrance into enterprises nearly three decades ago. I’m not referring to the early days of email and Usenet newsgroups, but the tidal wave of Web and e-Commerce applications that burst onto the business scene in the mid-to-late 1990’s. While those technologies brought much value to the enterprise, they also brought an avalanche of IT security concerns into the C-suite, leading to more authoritative roles for the CIO and the CISO. The fraction of enterprise budgets assigned to these IT functions (especially cybersecurity) suddenly and dramatically increased. That had and continues to have a very big and long-lasting impact.

The Web/e-Commerce tidal wave also brought a lot of hype and FOMO, which ultimately led to the Internet bubble burst (the dot-com crash) in the early 2000’s. AI, particularly the new wave of generative AI applications, has the potential to repeat this story, potentially unleashing a wave of similar patterns in the enterprise. Are we heading for another round of hype / high hopes / exhilaration / FOMO / crash and burn with AI? I hope not.

I would like to believe that a sound, rational, well justified, and strategic introduction of the new AI technologies (including ChatGPT and other generative AI applications) into enterprises can offer a better balance on the fast slopes of technological change (i.e., protecting enterprise leaders from getting out too far over their skis). In our earlier article, we discussed “AI Readiness is Not an Option.” In this article here, we offer some considerations for enterprise AI to add to those strategic conversations. Specifically, we look at considerations from the perspective of the fuel for enterprise AI applications: the algorithms, the data, and the enterprise AI infrastructure. Here is my list:

[continue reading the full article here]

AI Readiness is Not an Option

This year, artificial intelligence (AI) has become a major conversation centerpiece at home, in the park, at the gym, at work, everywhere. This is not entirely due to or related to ChatGPT and LLMs (large language models), though those have been the main drivers. The AI conversations, especially in technical circles, have focused intensively on generative AI, the creation of written content, images, videos, marketing copy, software code, speeches, and countless other things. For a short introduction to generative AI, see my article “Generative AI – Chapter 1, Page 1”.

While there has been huge public interest in generative AI (specifically, ChatGPT) by individuals, there has been a transformative impact on organizations everywhere, both in strategy conversations and tactical deployments. Businesses and others are seeking to leverage generative AI to increase productivity (efficiencies and effectiveness) in nearly all aspects of their enterprise.

To support essential enterprise AI strategy conversations, here are 12 key points for organizations to consider within the context of “AI readiness is not an option, but an imperative”:

[continue reading the full article here]

Built for AI – https://purefla.sh/41oS2Dp

Generative AI – Chapter 1, Page 1

Anyone who has been watching the AI space this year, even peripherally, will have noticed the flaming hot story of the year—ChatGPT and related chatbot applications. These AI applications are essentially deep machine learning models that are trained on hundreds of gigabytes of text and that can provide detailed, grammatically correct, and “mostly accurate” text responses to user inputs (questions, requests, or queries, which are called prompts). Specifically, these are LLMs—large language models. It is imperative, not an option, for organizations (and for most individuals) to be aware of what is going on here—not only because it is all over the news, but because it could affect your future self.

When I said “mostly accurate,” I meant that sometimes the ChatGPT responses go way off target—people refer to these as “hallucinations,” which is basically a reflection of the statistical basis of the models (see below)—the application will generate some plausible-sounding, grammatically correct statements that are complete falsehoods, such as “Leonardo da Vinci painted the Mona Lisa in 1815” (which is a real example of an observed ChatGPT hallucination).

I tested ChatGPT with my own account, and I was impressed with the results. I prompted it with various requests, including: Write a short story on a specific topic, provide a layperson’s explanations of some complex deep machine learning concepts, create a lesson plan to learn a tough subject, create an outline for a blog on a particular topic (no, not this one), and provide some financial advice on particular investments (no, it did not provide specific advice, but it did offer warnings like NFA “Not Financial Advice” and DYOR “Do Your Own Research”). You can find my results on my Medium blog site.

LLMs are so responsive and grammatically correct (even over many paragraphs of text) that some people worry that it is sentient. Guess what? It isn’t. It is merely a very large statistical model that provides the most likely sequence of words in response to a prompt. It is effectively a galaxy-sized statistically rich version of text autocomplete on your smartphone’s text messaging app, which already delivers some highly probable guesses for the missing words in a text message like this one: “Due to a client deadline, I will be working late at the ____ this ____, so I will be home late for ____.” LLMs can respond to much more complex (but well-posed) prompts, such as lesson plans for education, content for a business presentation, code for a software task, workflow steps for an IT project, and much more.

In order to help people to create well-posed prompts, the new discipline of prompt engineering has arisen. It’s not hard to find many online guides to prompt engineering, including guides for very specific industries, business tasks, workplace applications, and context-dependent scenarios. You don’t need prompt engineering to find those guides—a simple web search should do the trick. And guess what? When web search engines were first created, it took a while for us to learn how to submit well-posed keyword searches. That scenario is being played out again with ChatGPT and prompt engineering, but now our queries are aimed at a much more language-based, AI-powered, statistically rich application. If you understand Bayes’ Theorem and Bayesian statistics, then you will understand me when I say that we are talking here about an enormously more enriched set of priors, likelihoods, and evidence to feed the LLMs—so, it should not be surprising that the posteriors are shockingly good for large text outputs (most of the time).

LLMs are a subset of the deep learning field of natural language processing (NLP), which includes natural language understanding (NLU) and natural language generation (NLG). Think of chatbots and you get the idea, just expanded to a much, much larger domain of AI-based conversation.

Computer vision (CV) is another subset of deep learning, specifically aimed at object/pattern detection, recognition, and classification in images (including still images and video sequences). ChatGPT and LLMs are examples of generative AI using NLP for text generation. Stable Diffusion, Midjourney, and Dall-E are examples of generative AI using CV for image generation. Oh, by the way, I asked the generative AI at Stable Diffusion to create some images to go with my short story (which you can find on my Medium blog).

Beyond the individual examples of generative AI (and its components, ChatGPT, Stable Diffusion, etc.) that we can all experiment with, the applications in the enterprise can be tremendously impactful and transformative for organizations and the future of work. Those next chapters in the story are being written right now.

Continue reading about Enterprise AI in these posts:

  1. AI Readiness is Not an Option
  2. Top 9 Considerations for Enterprise AI

Editorial Review of “Building Industrial Digital Twins”

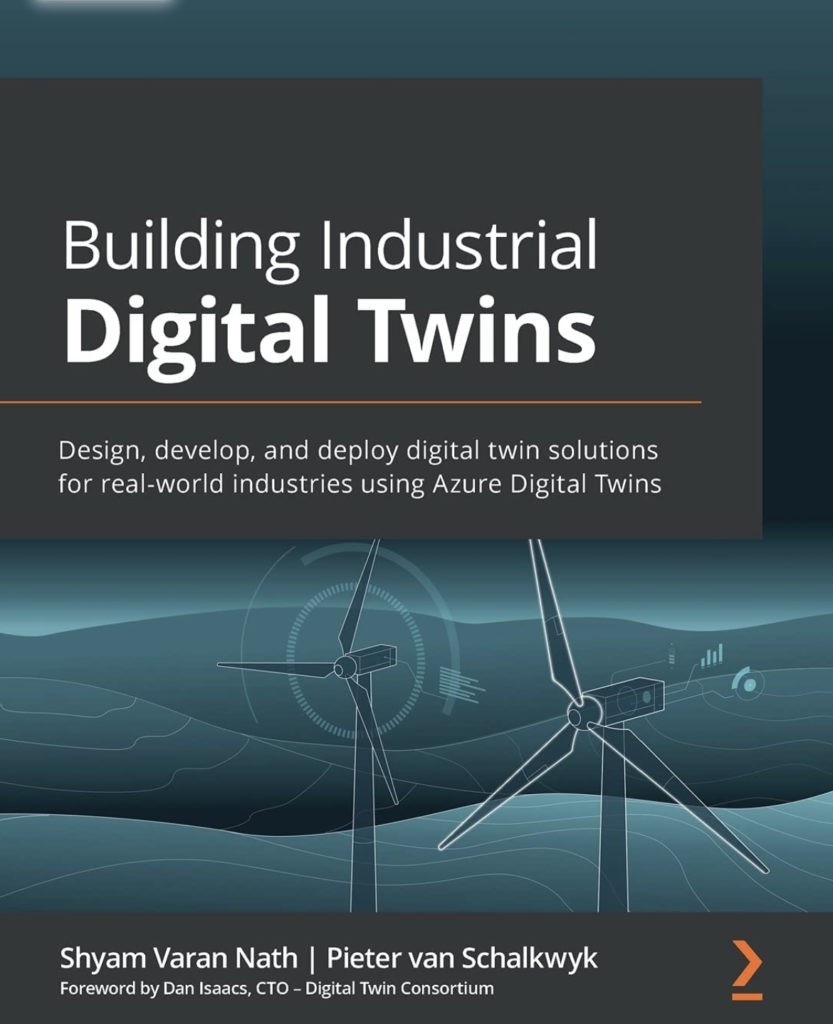
I was asked by the publisher to provide an editorial review of the book “Building Industrial Digital Twins: Design, develop, and deploy digital twin solutions for real-world industries using Azure Digital Twins“, by Shyam Varan Nath and Pieter van Schalkwyk. For this, I received a complimentary copy of the book and no other compensation.

Let us begin…

This book is a very timely contribution to the world of industrial digital transformation. The digital twin is more than a data collector. It is an insight engine, providing not only data for descriptive and diagnostic analytics applications, but also providing essential data for predictive and prescriptive analytics applications. This is all fueled and facilitated by data flows across processes, products, and people’s activities, used in synergy with computational models and simulations of the system being digitally twinned. In order to help an organization get started with a DT (digital twin), this book outlines the process of building the MVT (Minimum Viable Twin). All phases of the MVT process are discussed: strategy, designs, pilot, implementation, test, validation, operations, and monitoring. 

This book knows and forcefully proves what is the enabler and value producer of digital anything (especially and most emphatically the DT) — it is all about the data and the simulation — that’s business modeling at its finest, incorporating the best of technology (physical assets, sensors, and cloud), techniques (analytics, algorithms, and modeling), and talent (culture, people, and strategic plans).

There were many themes and topics (both broad and specific) that fascinated me and kept me engaged in discovering serendipitous knowledge nuggets throughout this book. Here are a few: 

1) Azure DT, whose cloud-based PaaS (Platform-as-a-Service) provides a viable, scalable, and accessible launchpad for DTaaS in any organization.

2) Streaming sensor data from the IoT (Internet of Things) and IIoT (Industrial IoT) become the source for an IoC (Internet of Context), ultimately delivering Insights-aaS, Context-aaS, and Forecasting-aaS.

3) The consistent emphasis on and elaboration of key DT value propositions, requirements, and KPI tracking.

4) The DT Canvas (chapter 4)!

5) Helpful discussions of phased DT deployments, prototypes, pilots, feedback, and validation.

6) Specific Industry 4.0 examples, with constant reminders that’s it all about the data plus analytics!

7) Forward-looking DTs in the industrial enterprise.

Beyond being a technical how-to manual (though it is definitely that), this book delivers so much more! It is truly a business digital transformation manual.

My top learning and pondering moments at Splunk .conf22

I recently attended the Splunk .conf22 conference. While the event was live in-person in Las Vegas, I attended virtually from my home office. Consequently I missed the incredible in-person experience of the brilliant speakers on the main stage, the technodazzle of 100’s of exhibitors’ offerings in the exhibit arena, and the smooth hip hop sounds from the special guest entertainer — guess who?

What I missed in-person was more than compensated for by the incredible online presentations by Splunk leaders, developers, and customers. If you have ever attended a major expo at one of the major Vegas hotels, you know that there is a lot of walking between different sessions — literally, miles of walking per day. That’s good for you, but it often means that you don’t attend all of the sessions that you would like because of the requisite rushing from venue to venue. None of that was necessary on the Splunk .conf22 virtual conference platform. I was able to see a lot, learn a lot, be impressed a lot, and ponder a lot about all of the wonderful features, functionalities, and future plans for the Splunk platform.

One of the first major attractions for me to attend this event is found in the primary descriptor of the Splunk Platform — it is appropriately called the Splunk Observability Cloud, which includes an impressive suite of Observability and Monitoring products and services. I have written and spoken frequently and passionately about Observability in the past couple of years. For example, I wrote this in 2021:

“Observability emerged as one of the hottest and (for me) most exciting developments of the year. Do not confuse observability with monitoring (specifically, with IT monitoring). The key difference is this: monitoring is what you do, and observability is why you do it. Observability is a business strategy: what you monitor, why you monitor it, what you intend to learn from it, how it will be used, and how it will contribute to business objectives and mission success. But the power, value, and imperative of observability does not stop there. Observability meets AI – it is part of the complete AIOps package: ‘keeping an eye on the AI.’ Observability delivers actionable insights, context-enriched data sets, early warning alert generation, root cause visibility, active performance monitoring, predictive and prescriptive incident management, real-time operational deviation detection (6-Sigma never had it so good!), tight coupling of cyber-physical systems, digital twinning of almost anything in the enterprise, and more. And the goodness doesn’t stop there.”

Continue reading my thoughts on Observability at http://rocketdatascience.org/?p=1589

The dominant references everywhere to Observability was just the start of awesome brain food offered at Splunk’s .conf22 event. Here is a list of my top moments, learnings, and musings from this year’s Splunk .conf:

  1. Observability for Unified Security with AI (Artificial Intelligence) and Machine Learning on the Splunk platform empowers enterprises to operationalize data for use-case-specific functionality across shared datasets. (Reference)
  2. The latest updates to the Splunk platform address the complexities of multi-cloud and hybrid environments, enabling cybersecurity and network big data functions (e.g., log analytics and anomaly detection) across distributed data sources and diverse enterprise IT infrastructure resources. (Reference)
  3. Splunk Enterprise 9.0 is here, now! Explore and test-drive it (with a free trial) here.
  4. The new Splunk Enterprise 9.0 release enables DevSecOps users to gain more insights from Observability data with Federated Search, with the ability to correlate ops with security alerts, and with Edge Management, all in one platform. (Reference)
  5. Security information and event management (SIEM) on the Splunk platform is enhanced with end-to-end visibility and platform extensibility, with machine learning and automation (AIOps), with risk-based alerting, and with Federated Search (i.e., Observability on-demand). (Reference)
  6. Customer success story: As a customer-obsessed bank with ultra-rapid growth, Nubank turned to Splunk to optimize data flows, analytics applications, customer support functions, and insights-obsessed IT monitoring. (Reference)
  7. The key characteristics of the Splunk Observability Cloud are Resilience, Security, Scalability, and EXTENSIBILITY. The latter specifically refers to the ease in which developers can extend Splunk’s capabilities to other apps, applying their AIOps and DevSecOps best practices and principles! Developers can start here.
  8. The Splunk Observability Cloud has many functions for data-intensive IT, Security, and Network operations, including Anomaly Detection Service, Federated Search, Synthetic Monitoring, Incident Intelligence, and much more. Synthetic monitoring is essentially digital twinning of your network and IT environment, providing insights through simulated risks, attacks, and anomalies via predictive and prescriptive modeling. [Reference]
  9. Splunk Observability Cloud’s Federated Search capability activates search and analytics regardless of where your data lives — on-site, in the cloud, or from a third party. (Reference)
  10. The new release of the Splunk Data Manager provides a simple, modern, automated experience of data ingest for Splunk Cloud admins, which reduces the time it takes to configure data collection (from hours/days to minutes). (Reference)
  11. Splunk works on data, data, data, but the focus is always on customer, customer, customer — because delivering best outcomes for customers is job #1. Explore Splunk’s amazing Partner ecosystem (Partnerverse) and the impressive catalog of partners’ solutions here.
  12. Splunk .conf22 Invites Organizations to Unlock Innovation With Data.

In summary, here is my list of key words and topics that illustrate the diverse capabilities and value-packed features of the Splunk Observability Cloud Platform that I learned about at the .conf22 event:

– Anomaly Detection Assistant
– Risk-based Alerting (powered by AI and Machine Learning scoring algorithms)
– Federated Search (Observability on-demand)
– End-to-End Visibility
– Platform Extensibility
– Massive(!) Scalability of the Splunk Observability Cloud (to billions of transactions per day)
– Insights-obsessed Monitoring (“We don’t need more information. We need more insights.”)
– APIs in Action (to Turn Data into Doing™)
– Splunk Incident Intelligence
– Synthetic Monitoring (Digital Twin of Network/IT infrastructure)
– Splunk Data Manager
– The Splunk Partner Universe (Partnerverse)

My closing thought — Cybersecurity is basically Data Analytics: detection, prediction, prescription, and optimizing for unpredictability. This is what Splunk lives for!

Follow me on LinkedIn here and on Twitter at @KirkDBorne.

Disclaimer: I was compensated as an independent freelance media influencer for my participation at the conference and for this article. The opinions expressed here are entirely my own and do not represent those of Splunk or of any Splunk partners. Any misrepresentations of the products and services mentioned in my statements are entirely my own responsibility. Nothing here should be construed as an offer to sell or as financial advice of any kind. My comments are entirely of a technical nature, focused on the technical capabilities of the items mentioned in the article.

Data Insights for Everyone — The Semantic Layer to the Rescue

What is a semantic layer? That’s a good question, but let’s first explain semantics. The way that I explained it to my data science students years ago was like this. In the early days of web search engines, those engines were primarily keyword search engines. If you knew the right keywords to search and if the content providers also used the same keywords on their website, then you could type the words into your favorite search engine and find the content you needed. So, I asked my students what results they would expect from such a search engine if I typed the following words into the search box: “How many cows are there in Texas?” My students were smart. They realized that the search results would probably not provide an answer to my question, but the results would simply list websites that included my words on the page or in the metadata tags: “Texas”, “Cows”, “How”, etc. Then, I explained to my students that a semantic-enabled search engine (with a semantic meta-layer, including ontologies and similar semantic tools) would be able to interpret my question’s meaning and then map that meaning to websites that can answer the question.

This was a good opening for my students to the wonderful world of semantics. I brought them deeper into the world by pointing out how much more effective and efficient the data professionals’ life would be if our data repositories had a similar semantic meta-layer. We would be able to go far beyond searching for correctly spelled column headings in databases or specific keywords in data documentation, to find the data we needed (assuming we even knew the correct labels, metatags, and keywords used by the dataset creators). We could search for data with common business terminology, regardless of the specific choice or spelling of the data descriptors in the dataset. Even more than that, we could easily start discovering and integrating, on-the-fly, data from totally different datasets that used different descriptors. For example, if I am searching for customer sales numbers, different datasets may label that “sales”, or “revenue”, or “customer_sales”, or “Cust_sales”, or any number of other such unique identifiers. What a nightmare that would be! But what a dream the semantic layer becomes!

When I was teaching those students so many years ago, the semantic layer itself was just a dream. Now it is a reality. We can now achieve the benefits, efficiencies, and data superhero powers that we previously could only imagine. But wait! There’s more.

Perhaps the greatest achievement of the semantic layer is to provide different data professionals with easy access to the data needed for their specific roles and tasks. The semantic layer is the representation of data that helps different business end-users discover and access the right data efficiently, effectively, and effortlessly using common business terms. The data scientists need to find the right data as inputs for their models — they also need a place to write-back the outputs of their models to the data repository for other users to access. The BI (business intelligence) analysts need to find the right data for their visualization packages, business questions, and decision support tools — they also need the outputs from the data scientists’ models, such as forecasts, alerts, classifications, and more. The semantic layer achieves this by mapping heterogeneously labeled data into familiar business terms, providing a unified, consolidated view of data across the enterprise.

The semantic layer delivers data insights discovery and usability across the whole enterprise, with each business user empowered to use the terminology and tools that are specific to their role. How data are stored, labeled, and meta-tagged in the data cloud is no longer a bottleneck to discovery and access. The decision-makers and data science modelers can fluidly share inputs and outputs with one another, to inform their role-specific tasks and improve their effectiveness. The semantic layer takes the user-specific results out of being a “one-off” solution on that user’s laptop to becoming an enterprise analytics accelerant, enabling business answer discovery at the speed of business questions.

Insights discovery for everyone is achieved. The semantic layer becomes the arbiter (multi-lingual data translator) for insights discovery between and among all business users of data, within the tools that they are already using. The data science team may be focused on feature importance metrics, feature engineering, predictive modeling, model explainability, and model monitoring. The BI team may be focused on KPIs, forecasts, trends, and decision-support insights. The data science team needs to know and to use that data which the BI team considers to be most important. The BI team needs to know and to use which trends, patterns, segments, and anomalies are being found in those data by the data science team. Sharing and integrating such important data streams has never been such a dream.

The semantic layer bridges the gaps between the data cloud, the decision-makers, and the data science modelers. The key results from the data science modelers can be written back to the semantic layer, to be sent directly to consumers of those results in the executive suite and on the BI team. Data scientists can focus on their tools; the BI users and executives can focus on their tools; and the data engineers can focus on their tools. The enterprise data science, analytics, and BI functions have never been so enterprisey. (Is “enterprisey” a word? I don’t know, but I’m sure you get my semantic meaning.)

That’s empowering. That’s data democratization. That’s insights democratization. That’s data fluency/literacy-building across the enterprise. That’s enterprise-wide agile curiosity, question-asking, hypothesizing, testing/experimenting, and continuous learning. That’s data insights for everyone.

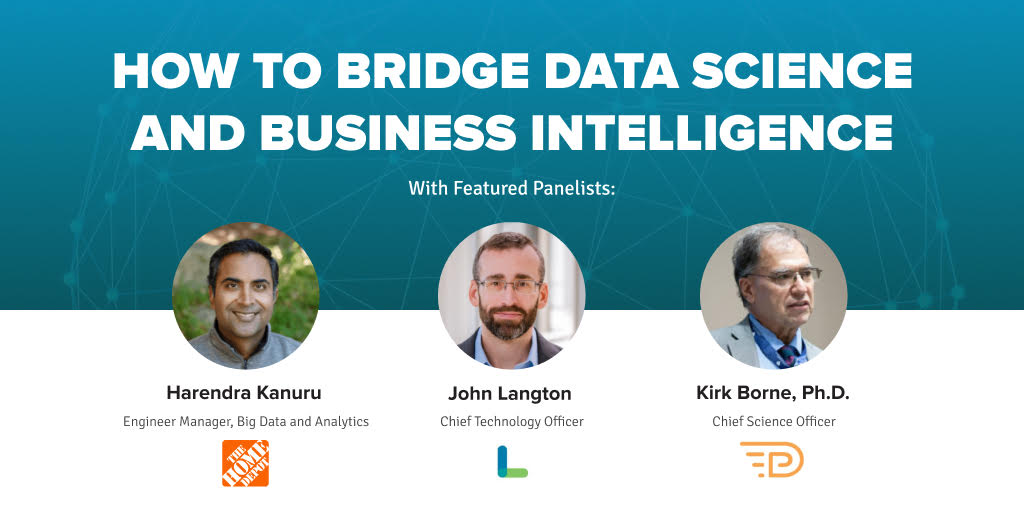
Are you ready to learn more how you can bring these advantages to your organization? Be sure to watch the AtScale webinar “How to Bridge Data Science and Business Intelligence” where I join a panel in a multi-industry discussion on how a semantic layer can help organizations make smarter data-driven decisions at scale. There will be several speakers, including me. I will be speaking about “Model Monitoring in the Enterprise — Filling the Gaps”, specifically focused on “Filling the Communication Gaps Between BI and Data Science Teams With a Semantic Data Layer.”

Register to attend and view the webinar at https://bit.ly/3ySVIiu.

https://bit.ly/3ySVIiu

Data Science Blogs-R-Us

[UPDATED December 31, 2022]

I have written articles in many places. I will be collecting links to those sources here. The list is not complete and will be constantly evolving. There are some older blogs that I will be including in the list below as I remember them and find them. Also included are some interviews in which I provided detailed answers to a variety of questions.

In 2019, I was listed as the #1 Top Data Science Blogger to Follow on Twitter.

And then there’s this — not a blog, but a link to my 2013 TedX talk: “Big Data, Small World.” (Many more videos of my talks are available online. That list will be compiled in another place soon.)

  1. Rocket-Powered Data Science (the website that you are now reading).
  2. https://medium.com/@kirk.borne
  3. https://www.the-yuan.com/search.html (Search for “Kirk Borne” blogs)
  4. https://www.datasciencecentral.com/author/kirkborne/
  5. https://medium.com/@relx/ai-adoption-in-2021-driven-by-many-external-factors-af5b848cee33
  6. https://muckrack.com/kirk-borne/articles
  7. https://www.govloop.com/author/kirkdborne/
  8. https://datamakespossible.westerndigital.com/tag/kirk-borne/
  9. https://www.linkedin.com/in/kirkdborne/detail/recent-activity/posts/
  10. https://www.linkedin.com/pulse/how-go-from-data-paradox-productivity-business-kirk-borne-ph-d-/
  11. https://blog.starburst.io/author/kirk-borne
  12. https://www.oreilly.com/people/kirk-borne/
  13. https://www.syntasa.com/blog/author/kirk-borne
  14. https://mapr.com/blog/author/kirk-borne/
  15. https://asistdl.onlinelibrary.wiley.com/doi/full/10.1002/bult.2013.1720390414
  16. https://www.thedatadreamer.com/insights/talk-the-walk-the-importance-of-fluency-in-data-storytelling/
  17. https://www.futureofbusinessandtech.com/business-ai/leveraging-artificial-intelligence-for-social-good/
  18. https://mindsdb.com/blog/predictions-at-the-speed-of-questions/?utm_source=kirk&utm_medium=blog&utm_campaign=wb
  19. https://blog.qlik.com/how-we-teach-the-leaders-of-tomorrow-to-be-curious-ask-questions-and-not-be-afraid-to-fail-fast-to-learn-fast
  20. https://www.boozallen.com/s/insight/blog/kirk-borne-on-building-data-science-models.html
  21. https://www.boozallen.com/s/insight/blog/the-power-of-data-science-and-ai-for-social-good.html
  22. https://odsc.com/blog/adapting-machine-learning-algorithms-to-novel-use-cases/
  23. https://www.kdnuggets.com/2019/01/data-scientist-dilemma-cold-start-machine-learning.html
  24. https://www.sas.com/en_us/insights/articles/analytics/data-scientist-data-literacy.html
  25. https://blogs.sas.com/content/sascom/2019/04/27/getting-practical-about-ai-with-kirk-borne/
  26. https://blogs.sas.com/content/sascom/2017/08/31/3-machine-learning-technologies-3-three-years/
  27. https://www.digitalistmag.com/future-of-work/2019/05/15/intelligent-enterprise-connecting-islands-of-innovation-06198471
  28. https://www.digitalistmag.com/cio-knowledge/2019/06/27/data-strategy-that-first-date-with-your-data-06199224
  29. https://blogs.oracle.com/author/kirk-borne
  30. https://blogs.thomsonreuters.com/answerson/doing-better-at-your-service-with-ai-as-a-service/
  31. https://www.aitimejournal.com/data-science-interview-with-kirk-borne-principal-data-scientist-booz-allen-hamilton
  32. https://insideanalysis.com/author/kirk-borne/
  33. http://researcher123.blogspot.com/2014/
  34. https://www.manthan.com/blogs/nrf-interview-with-kirk-borne-big-data-hype-the-worst-is-behind-us/
  35. https://www.thinkful.com/blog/meet-the-experts-dr-kirk-borne/
  36. https://itpeernetwork.intel.com/author/kirkborne/#gs.6zd0x8
  37. https://www.ibmbigdatahub.com/blog/author/kirk-borne
  38. https://www.laserfiche.com/ecmblog/3-questions-kirk-borne-about-big-data/

Glossary of Digital Terminology for Career Relevance

Career Relevance - keeping you digitally literate
Career Relevance

Definitions of terminology frequently seen and used in discussions of emerging digital technologies.

Additive Manufacturing: see 3D-Printing

AGI (Artificial General Intelligence): The intelligence of a machine that has the capacity to understand or learn any intellectual task that a human being can. It is a primary goal of some artificial intelligence research and a common topic in science fiction and future studies.

AI (Artificial Intelligence): Application of Machine Learning algorithms to robotics and machines (including bots), focused on taking actions based on sensory inputs (data). Examples: (1-3) All those applications shown in the definition of Machine Learning. (4) Credit Card Fraud Alerts. (5) Chatbots (Conversational AI). There is nothing “artificial” about the applications of AI, whose tangible benefits include Accelerated Intelligence, Actionable Intelligence (and Actionable Insights), Adaptable Intelligence, Amplified Intelligence, Applied Intelligence, Assisted Intelligence, and Augmented Intelligence.

Algorithm: A set of rules to follow to solve a problem or to decide on a particular action (e.g., the thermostat in your house, or your car engine alert light, or a disease diagnosis, or the compound interest growth formula, or assigning the final course grade for a student).

Analytics: The products of Machine Learning and Data Science (such as predictive analytics, health analytics, cyber analytics).

AR (Augmented Reality): A technology that superimposes a computer-generated image on a user’s view of the real world, thus providing a composite view. Examples: (1) Retail. (2) Disaster Response. (3) Machine maintenance. (4) Medical procedures. (5) Video games in your real world. (6) Clothes shopping & fitting (seeing the clothes on you without a dressing room). (7) Security (airports, shopping malls, entertainment & sport events).

Autonomous Vehicles: Self-driving (guided without a human), informed by data streaming from many sensors (cameras, radar, LIDAR), and makes decisions and actions based on computer vision algorithms (ML and AI models for people, things, traffic signs,…). Examples: Cars, Trucks, Taxis

BI (Business Intelligence): Technologies, applications and practices for the collection, integration, analysis, and presentation of business information. The purpose of Business Intelligence is to support better business decision-making.

Big Data: An expression that refers to the current era in which nearly everything is now being quantified and tracked (i.e., data-fied). This leads to the collection of data and information on nearly full-population samples of things, instead of “representative subsamples”. There have been many descriptions of the characteristics of “Big Data”, but the three dominant attributes are Volume, Velocity, and Variety — the “3 V’s” concept was first introduced by Doug Laney in 2001 here. Read more in this article: “Why Today’s Big Data is Not Yesterday’s Big Data“. Some consider the 2011 McKinsey & Company research report “Big Data: The Next Frontier for Innovation, Competition, and Productivity” as the trigger point when the world really started paying attention to the the volume and variety of data that organizations everywhere are collecting — the report stated, “The United States alone could face a shortage of 140,000 to 190,000 people with deep analytical skills as well as 1.5 million managers and analysts with the know-how to use the analysis of big data to make effective decisions.”

Blockchain: A system in which a permanent and verifiable record of transactions is maintained across several computers that are linked in a peer-to-peer network. It has many applications beyond its original uses for bitcoin and other cryptocurrencies. Blockchain in an example of Distributed Ledger Technology, in which independent computers (referred to as nodes) record, share and synchronize transactions in their respective electronic ledgers (instead of keeping data centralized as in a traditional ledger). Blockchain’s name refers to a chain (growing list) of records, called blocks, which are linked using cryptography, and are used to record transactions between two parties efficiently and in a verifiable and permanent way. In simplest terms, Blockchain is a distributed database existing on multiple computers at the same time. It grows as new sets of recordings, or ‘blocks’, are added to it, forming a chain. The database is not managed by any particular body; instead, everyone in the network gets a copy of the whole database. Old blocks are preserved forever and new blocks are added to the ledger irreversibly, making it impossible to manipulate by faking documents, transactions and other information. All blocks are encrypted in a special way, so everyone can have access to all the information but only a user who owns a special cryptographic key is able to add a new record to a particular chain.

Chatbots (see also Virtual Assistants): These typically are text-based user interfaces (often customer-facing for organizations) that are designed and programmed to reply to only a certain set of questions or statements. If the question asked is other than the learned set of responses by the customer, the chatbot will fail. Chatbots cannot hold long, continuing human interaction. Traditionally they are text-based but audio and pictures can also be used for interaction. They provide more like an FAQ (Frequently Asked Questions) type of an interaction. They cannot process language inputs generally.

Cloud: The cloud is a metaphor for a global network of remote servers that operates transparently to the user as a single computing ecosystem, commonly associated with Internet-based computing.

Cloud Computing: The practice of using a network of remote servers hosted on the Internet to store, manage, and process data, rather than a local server, local mainframe, or a personal computer.

Computer Vision: An interdisciplinary scientific field that focuses on how computers can be made to gain high-level understanding from digital images or videos. From the perspective of engineering, it seeks to automate tasks that the human visual system can do, including pattern detection, pattern recognition, pattern interpretation, and pattern classification.

Data Mining: Application of Machine Learning algorithms to large data collections, focused on pattern discovery and knowledge discovery in data. Pattern discovery includes clusters (class discovery), correlation (and trend) discovery, link (association) discovery, and anomaly detection (outlier detection, surprise discovery).

Data Science: Application of scientific method to discovery from data (including Statistics, Machine Learning, data visualization, exploratory data analysis, experimentation, and more).

Digital Transformation: Refers to the novel use of digital technology to solve traditional problems. These digital solutions enable — other than efficiency via automation — new types of innovation and creativity, rather than simply enhance and support traditional methods.

Digital Twins: A phrase used to describe a computerized (or digital) version of a real physical asset and/or process. The digital twin contains one or more sensors that collects data to represent real-time information about the physical asset. By bridging the physical and the virtual world, data is transmitted seamlessly allowing the virtual entity to exist simultaneously with the physical entity. Digital Twins are used in manufacturing, large-scale systems (such as maritime vessels, wind farms, space probes) and other complex systems. Digital Twins are virtual replicas of physical devices that data scientists and IT pros can use to run simulations before actual devices are built and deployed, and also while those devices are in operation. They represent a strong merging and optimization of numerous digital technologies such as IoT (IIoT), AI, Machine Learning, and Big Data Analytics.

Drone (UAV, UAS): An unmanned aerial vehicle (UAV) or uncrewed aerial vehicle (commonly known as a Drone) is an aircraft without a human pilot on board. UAVs are a component of an unmanned aircraft system (UAS); which include a UAV, a ground-based controller, and a system of communications between the two.

Dynamic Data-driven Application (Autonomous) Systems (DDDAS): A paradigm in which the computation and instrumentation aspects of an application system are dynamically integrated in a feed-back control loop, such that instrumentation data can be dynamically incorporated into the executing model of the application, and in reverse the executing model can control the instrumentation. Such approaches can enable more accurate and faster modeling and analysis of the characteristics and behaviors of a system and can exploit data in intelligent ways to convert them to new capabilities, including decision support systems with the accuracy of full scale modeling, efficient data collection, management, and data mining. See http://dddas.org/.

Edge Computing (and Edge Analytics): A distributed computing paradigm which brings computation to the data, closer to the location where it is needed, to improve response times in autonomous systems and to save bandwidth. Edge Analytics specifically refers to an approach to data collection and analysis in which an automated analytical computation is performed on data at a sensor, network switch or other device instead of waiting for the data to be sent back to a centralized data store. This is important in applications where the result of the analytic computation is needed as fast as possible (at the point of data collection), such as in autonomous vehicles or in digital manufacturing.

Industry 4.0: A reference to a new phase in the Industrial Revolution that focuses heavily on interconnectivity, automation, Machine Learning, and real-time data. Industry 4.0 is also sometimes referred to as IIoT (Industrial Internet of Things) or Smart Manufacturing, because it joins physical production and operations with smart digital technology, Machine Learning, and Big Data to create a more holistic and better connected ecosystem for companies that focus on manufacturing and supply chain management.

IoT (Internet of Things) and IIoT (Industrial IoT): Sensors embedded on devices and within things everywhere, measuring properties of things, and sharing that data over the Internet (over fast 5G), to fuel ML models and AI applications (including AR and VR) and to inform actions (robotics, autonomous vehicles, etc.). Examples:  (1) Wearable health devices (Fitbit). (2) Connected cars. (3) Connected products. (4) Precision farming. (5) Industry 4.0

Knowledge Graphs (see also Linked Data): Knowledge graphs encode knowledge arranged in a network of nodes (entities) and links (edges) rather than tables of rows and columns. The graph can be used to link units of data (the nodes, including concepts and content), with a link (the edge) that explicitly specifies what type of relationship connects the nodes.

Linked Data (see also Knowledge Graphs): A data structure in which data items are interlinked with other data items that enables the entire data set to be more useful through semantic queries. The easiest and most powerful standard designed for Linked Data is RDF (Resource Description Framework).

Machine Learning (ML): Mathematical algorithms that learn from experience (i.e., pattern detection and pattern recognition in data). Examples:  (1) Digit detection algorithm (used in automated Zip Code readers at Post Office. (2) Email Spam detection algorithm (used for Spam filtering). (3) Cancer detection algorithm (used in medical imaging diagnosis). 

MR (Mixed Reality): Sometimes referred to as hybrid reality, is the merging of real and virtual worlds to produce new environments and visualizations where physical and digital objects co-exist and interact in real time. It means placing new imagery within a real space in such a way that the new imagery is able to interact, to an extent, with what is real in the physical world we know. The key characteristic of MR is that the synthetic content and the real-world content are able to react to each other in real time.

NLP (Natural Language Processing), NLG (NL Generation), NLU (NL Understanding): NLP a subfield of computer science, information engineering, and artificial intelligence concerned with the interactions between computers and human languages, in particular how to program computers to process and analyze large amounts of natural language data. NLG is a software process that transforms structured data into human-language content. It can be used to produce long form content for organizations to automate custom reports, as well as produce custom content for a web or mobile application, or produce the words that will be spoken by a Virtual (Voice-based) Assistant. NLU is a subtopic of Natural Language Processing in Artificial Intelligence that deals with algorithms that have language comprehension (understanding the meaning of the words, both their content and their context).

Quantum Computing: The area of study focused on developing computer technology based on the principles of quantum theory and quantum phenomena (such as superposition of states and entanglement). Qubits are the fundamental units of quantum computing — they are somewhat analogous to bits in a classical computer.

Robotics: A branch of AI concerned with creating devices that can move and react to sensory input (data). Examples: (1) Automated manufacturing assembly line. (2) Roomba (vacuums your house). (3) Warehouse / Logistics. (4) Prosthetics.

Statistics: the practice or science of collecting and analyzing numerical data, especially for the purpose of inferring proportions in a whole population from measurements of those properties within a representative subsample.

UAV (Unmanned Aerial Vehicle) and UAS (Unmanned Aircraft System): see Drones.

Virtual Assistants (see also Chatbots): A sophisticated voice-based interface in an interactive platform for user and customer interactions. Virtual assistants understand not only the language but also the meaning of what the user is saying. They can learn from their conversation instances, which can lead to an unpredictability in their behavior. Consequently, they can have extended adaptable human interaction. They can be set to perform slightly complicated tasks as well, such as order-taking and task fulfillment.

VR (Virtual Reality): Computer-generated simulation of a three-dimensional environment that can be interacted with in a seemingly real or physical way by a person using special electronic equipment, such as a helmet with a screen inside or gloves fitted with sensors. Examples: (1) Games. (2) Family adventures. (3) Training & Education. (4) Design. (5) Big Data Exploration.

XAI (eXplainable AI, Trusted AI): Artificial intelligence that is programmed to describe (explain) its purpose, rationale and decision-making process in a way that can be understood by the average person. This includes the specific criteria the program uses to arrive at a decision.

XPU: One of the many specialized CPUs for specific applications (similar to an ASIC), which may be real-time, data-intensive, data-specific, or at the edge (see Edge Analytics). For more information, refer to the article “Sensor Analytics at Micro Scale on the xPU“.

3D-Printing … moving on to 4D-printing: Additive Manufacturing — the action or process of making a physical object from a three-dimensional digital model, typically by laying down many thin layers of a material in succession. The terms “additive manufacturing” and “3D printing” both refer to creating an object by sequentially adding build material in successive cross-sections, one stacked upon another.

5G: Fifth-generation wireless, the latest iteration of cellular technology, engineered to greatly increase the speed and responsiveness of wireless networks. 5G will also enable a sharp increase in the amount of data transmitted over wireless systems due to more available bandwidth. Example applications: (1) High-definition and 3D video. (2) Gbit/sec Internet. (3) Broadband network access nearly everywhere. (4) IoT.