Category Archives: Data Science

Three Types of Actionable Business Analytics Not Called Predictive or Prescriptive

Decades (at least) of business analytics writings have focused on the power, perspicacity, value, and validity in deploying predictive and prescriptive analytics for business forecasting and optimization, respectively. These are primarily forward-looking actionable (proactive) applications. 

There are other dimensions of analytics that tend to focus on hindsight for business reporting and causal analysis – these are descriptive and diagnostic analytics, respectively, which are primarily reactive applications, mostly explanatory and investigatory, not necessarily actionable.

In the world of data there are other types of nuanced applications of business analytics that are also actionable – perhaps these are not too different from predictive and prescriptive, but their significance, value, and implementation can be explained and justified differently. Before we dive into these additional types of analytics applications, let us first consider a little pedagogical exercise with two simple evidence-based inferences.

(a) In essentially 100% of cases where an automobile is involved in an accident, the automobile had four wheels on the car prior to the accident.

(b) In 100% of divorce cases, the divorcing couple was married prior to the divorce.

What is the point of those obvious statistical inferences? The point is that the 100% association between the event and the preceding condition has no special predictive or prescriptive power. Hence, prior knowledge of these 100% associations does not offer any actionable value. In statistical terms, the joint probability of event Y and condition X co-occurring, designated P(X,Y), is essentially the probability P(Y) of event Y occurring. The probability of the condition X occurring, P(X), is irrelevant since the existence of the precondition X is implicitly present by default.

Okay, those examples represent two remarkably uninteresting cases. Even when similar sorts of inferences occur in a business context, they have essentially zero value. How do predictive and prescriptive analytics fit into this statistical framework?

Using the same statistical terminology, the conditional probability P(Y|X) (the probability of Y occurring, given the presence of precondition X) is an expression of predictive analytics. By exploring and analyzing the business data, analysts and data scientists can search for and uncover such predictive relationships. This is predictive power discovery. Another way of saying this is: given observed data X, we can predict some outcome Y. Or more simply: given X, find Y.

Similarly (actually, conversely), we can use the conditional probability P(X|Y) (which is the probability that the precondition X exists, given the existence of outcome Y) as an expression of prescriptive analytics. How does that work in practice? By exploring and analyzing business data, analysts and data scientists can search for and uncover the conditions (causal factors) that have led to different outcomes. So, if the business wants to optimize some outcome Y, then data analysts will be tasked with finding the conditions X that must be implemented to achieve that desired outcome. This is prescriptive power discovery. Another way of saying this is: given some desired optimal outcome Y, what conditions X should we put in place. Or more simply: given Y, find X. Note how this simple mathematical expression of prescriptive analytics is exactly the opposite of our previous expression of predictive analytics (given X, find Y).

Here are a few business examples of this type of prescriptive analytics: Which marketing campaign is most efficient and effective (has best ROI) in optimizing sales? Which environmental factors during manufacturing, packaging, or shipping lead to reduced product returns? Which pricing strategies lead to the best business revenue? What equipment maintenance schedule minimizes failures, downtime (mean time to recovery), and overall maintenance costs?

Now that we have described predictive and prescriptive analytics in detail, what is there left? What are the three types of actionable (and valuable) business analytics applications that are not called predictive or prescriptive? They are sentinel, precursor, and cognitive analytics. Let’s define what these are.

  1. Sentinel Analytics – in common usage, the sentinel is the person on the guard station who is charged with watching for significant incoming or emergent activity. In practice, all activity is being observed and a decision is made as to whether any particular activity requires some sort of triage: sounding an alarm, or sending an alert to decision-makers, or doing nothing.
    • In the enterprise, sentinel analytics is most timely and beneficial when applied to real-time, dynamic data streams and time-critical decisions. For example, sensors (including internet of things devices and APIs on data networks) can be deployed with logic (analytics, statistical, and/or machine learning algorithms) to monitor and “watch” business systems and processes for emerging patterns, trends, behaviors, unusual operating modes, and anomalies that might be indicators of activities that require business attention, decisions, and/or action. 
  2. Precursor Analytics – in common usage, precursors are the early-warning indicators (harbingers, forerunners) of something else more serious or catastrophic that is about to come. We occasionally hear about earthquake precursors (increased levels of radon in groundwater), tidal wave precursors (a deep ocean earthquake), and cyber-attack precursors (phishing incidents). Precursor analytics is related to sentinel analytics. The latter (sentinel) is associated primarily with “watching” the data for interesting patterns that might require action, while precursor analytics is associated primarily with training the business systems to quickly identify those specific “learned” patterns and events that are known to be associated with high-risk events, thus requiring timely attention, intervention, and remediation. 
    • In these applications, the data science involvement includes both the “learning” of the most significant patterns to alert on and the improvement of their models (logic) to minimize false positives and false negatives. The analytics triage is critical, to avoid alarm fatigue (sending too many unimportant alerts) and to avoid underreporting of important actionable events. One could say that sentinel analytics is more like unsupervised machine learning, while precursor analytics is more like supervised machine learning. That is not a totally clean separation and distinction, but it might help to clarify their different applications of data science. 
    • The counterexample to the supervised learning explanation of precursor analytics is a “black swan” event – a rare high-impact event that is difficult to predict under normal circumstances – such as the global pandemic, which led to the failure of many predictive models in business. Broken models are definitely disruptive to analytics applications and business operations. Paradoxically, the precursor was actually predictive in a disruptive anti-predictive sort of way, which brings us right back to P(Y|X), or maybe it should be stated as P(“not Y”|X) where X is the black swan event (i.e., the predicted outcome Y from existing models will not occur in this case). As such, the global pandemic serves as a warning (a harbinger of disruption) and consequently as a “training example” to businesses for any future black swans. 
  3. Cognitive Analytics – this analytics mindset approach focuses on “surprise” discovery in data, using machine learning and AI to emulate and automate the cognitive abilities of humans. The goal is to discover novel, interesting, unexpected, and potentially valuable signals in the flood of streaming enterprise data. These may not be high-risk discoveries, but they could be high-reward discoveries. How does that resemble human cognitive abilities? Curiosity! Being curious about seeing something “funny” that you didn’t expect, thereby putting a “marker” in the data stream: “Look here! Pay attention! Ask questions about this!” 
    • Cognitive analytics is basically the opposite of descriptive analytics. In descriptive analytics, the task is to find answers to predetermined business questions (how much, how many, how often, who, where, when), whereas cognitive analytics is tasked with finding the business questions that should be asked. Descriptive: find the right answers in the data. Cognitive: find the right questions in the data. Cognitive analytics can then be viewed as a precursor to diagnostic analytics, which is the investigative stage of analytics that answers the questions raised by cognitive analytics (“Why did this happen?”, “Why are we seeing this pattern in our data?”, “What is the business impact of this trend, anomaly, behavior?”, “What is our next-best action as a result of this?”, “That’s funny! What is that?”).

None of these descriptions of the 3 “new” analytics applications are meant to declare that these are completely distinct and different from the “big 4” analytics applications that we have known for many years (Descriptive, Diagnostic, Predictive, Prescriptive). But the differences between the “big 4” and the “new 3” are in the nuanced business applications of these analytics in the enterprise and in the types of inferences that the data scientists are asked to derive from the business data. 

Deploying these analytics in the cloud further expands their accessibility, democratization, enterprise-wide acceptance, broad advocacy, and ultimate business value. Blending automated analytics products (coming from the sentinel, precursor, and cognitive applications) with human-in-the-loop inquisitiveness, curiosity, creativity, out-of-the-box thinking, idea generation, and persistence can transform any organization into a data analytics powerhouse through an analytic culture revolution. This is more imperative than ever, as a global survey of analytics executives has revealed:

  • “Companies have been working to become more data-driven for many years, with mixed results.”
  • “Right now, the biggest challenge for organizations working on their data strategy might not have to do with technology at all.”
  • “Corporate chief data, information, and analytics executives reported that cultural change is the most critical business imperative.”
  • “Just 26.5% of organizations report having established a data-driven organization.”
  • “91.9% of executives cite cultural obstacles as the greatest barrier to becoming data driven.”
  • Reference: https://hbr.org/2022/02/why-becoming-a-data-driven-organization-is-so-hard

Where do organizations get help to overcome these challenges? Microsoft delivers what its clients need to help them grow their top line with cloud-based analytics. Microsoft’s cloud-based analytics products and services propel business insights, innovation, and value from enterprise data, with all of the dimensions of analytics applications brought into the game. Specifically, cloud analytics (accessing and inferencing on multiple diverse business datasets across business units) for a wide variety of enterprise applications can sharpen the workforce’s focus on value and growth, including: forward-looking insights through predictive, sentinel, and precursor analytics; novel recommendations; rich customer engagement; analytic product innovation; resilience through prescriptive analytics; surprise discovery in data, asking the right questions, and exploring the most insightful lines of inquiry through cognitive analytics; and more.

Microsoft Azure Cloud extends ease-of-access analytics to all, delivers increased speed to deployment, provides leading security, compliance, and governance – with price performance for any organization. Whether organizations are seeking scalability in their enterprise data systems, advanced analytics capabilities (including the “big 4” and the “new 3”), real-time analytics (essential value-drivers from streaming data, including IoT, network logs, online customer interactions, supply chain, etc.), and the best in machine learning model-building and deployment services, Microsoft Azure Cloud has you covered. To learn more about it, go to https://azure.microsoft.com/en-us/solutions/cloud-scale-analytics and bring actionable business analytics to higher levels of proficiency and productivity across your organization.

Three Emerging Analytics Products Derived from Value-driven Data Innovation and Insights Discovery in the Enterprise

I recently saw an informal online survey that asked users which types of data (tabular, text, images, or “other”) are being used in their organization’s analytics applications. This was not a scientific or statistically robust survey, so the results are not necessarily reliable, but they are interesting and provocative. The results showed that (among those surveyed) approximately 90% of enterprise analytics applications are being built on tabular data. The ease with which such structured data can be stored, understood, indexed, searched, accessed, and incorporated into business models could explain this high percentage. A similarly high percentage of tabular data usage among data scientists was mentioned here.

If my explanation above is the correct interpretation of the high percentage, and if the statement refers to successfully deployed applications (i.e., analytics products, in contrast to non-deployed training experiments, demos, and internal validations of the applications), then maybe we would not be surprised if a new survey (not yet conducted) was to reveal that a similar percentage of value-producing enterprise data innovation and analytics/ML/AI applications (hereafter, “analytics products”) are based on on-premises (on-prem) data sources. Why? … because the same productivity benefits mentioned above for tabular data sources (fast and easy data access) would also be applicable in these cases (on-prem data sources). And no one could deny that these benefits would be substantial. What could be faster and easier than on-prem enterprise data sources?

Accompanying the massive growth in sensor data (from ubiquitous IoT devices, including location-based and time-based streaming data), there have emerged some special analytics products that are growing in significance, especially in the context of innovation and insights discovery from on-prem enterprise data sources. These enterprise analytics products are related to traditional predictive and prescriptive analytics, but these emergent products may specifically require low-latency (on-prem) data delivery to support enterprise requirements for timely, low-latency analytics product delivery. These three emergent analytics products are:

(a) Sentinel Analytics – focused on monitoring (“keeping an eye on”) multiple enterprise systems and business processes, as part of an observability strategy for time-critical business insights discovery and value creation from enterprise data sources. For example, sensors can monitor and “watch” systems and processes for emergent trends, patterns, anomalies, behaviors, and early warning signs that require interventions. Monitoring of data sources can include online web usage actions, streaming IT system patterns, system-generated log files, customer behaviors, environmental (ESG) factors, energy usage, supply chain, logistics, social and news trends, and social media sentiment. Observability represents the business strategy behind the monitoring activities. The strategy addresses the “what, when, where, why, and how” questions from business leaders concerning the placement of “sensors” that are used to collect the essential data that power the sentinel analytics product, in order to generate timely insights and thereby enable better data-informed “just in time” business decisions.

(b) Precursor Analytics – the use of AI and machine learning to identify, evaluate, and generate critical early-warning alerts in enterprise systems and business processes, using high-variety data sources to minimize false alarms (i.e., using high-dimensional data feature space to disambiguate events that seem to be similar, but are not). Precursor analytics is related to sentinel analytics. The latter is associated primarily with “watching” the data for interesting patterns, while precursor analytics is associated primarily with training the business systems to quickly identify those specific patterns and events that could be associated with high-risk events, thus requiring timely attention, intervention, and remediation. One could say that sentinel analytics is more like unsupervised machine learning, while precursor analytics is more like supervised machine learning. That is not a totally clear separation and distinction, but it might help to clarify their different applications of data science. Data scientists work with business users to define and learn the rules by which precursor analytics models produce high-accuracy early warnings. For example, an exploration of historical data may reveal that an increase in customer satisfaction (or dissatisfaction) with one particular product is correlated with some other satisfaction (or dissatisfaction) metric downstream at a later date. Consequently, based on this learning, deploying a precursor analytics product to detect the initial trigger event early can thus enable a timely response to the situation, which can produce a positive business outcome and prevent an otherwise certain negative outcome.

(c) Cognitive Analytics – focused on “surprise” discovery in diverse data streams across numerous enterprise systems and business processes, using machine learning and data science to emulate and automate the curiosity and cognitive abilities of humans – enabling the discovery of novel, interesting, unexpected, and potentially business-relevant signals across all enterprise data streams. These may not be high risk. They might actually be high-reward discoveries. For example, in one company, an employee noticed that it was the customer’s birthday during their interaction and offered a small gift to the customer at that moment—a gift that was pre-authorized by upper management because they understood that their employees are customer-facing and they anticipated that their employees would need to have the authority to take such customer-pleasing actions “in the moment”. The outcome was very positive indeed, as this customer reported the delightful experience on their social media account, thereby spreading positive sentiment about the business to a wide audience. Instead of relying on employees to catch all surprises in the data streams, the enterprise analytics applications can be trained to automatically watch for, identify, and act on these surprises. In the customer birthday example, the cognitive analytics product can be set up for automated detection and response, which can occur without the employee in the loop at all, such as in a customer’s online shopping experience or in a chat with the customer call center bot.

These three analytics products are derived from business value-driven data innovation and insights discovery in the enterprise. Investigating and deploying these are a worthy strategic move for any organization that is swimming in a sea (or lake or ocean) of on-prem enterprise data sources.

In closing, let us look at some non-enterprise examples of these three types of analytics:

  • Sentinel – the sentinel on the guard station at a military post is charged with watching for incoming activity. They are assigned this duty just in case something occurs during the night or when everyone else is busy with other operational things. That “something” might be an enemy approaching or a wild bear in the forest. In either case, keeping an eye on the situation is critical for the success of the operation. Another example of a sentinel is a marked increase in the volatility of stock market prices, indicating that there may be a lot of FUD (fear, uncertainty, and doubt) in the market that could lead to wild swings or downturns. In fact, anytime that any streaming data monitoring metric shows higher than usual volatility, this may be an indicator that the monitored thing requires some attention, an investigation, and possibly an intervention.
  • Precursor – prior to large earthquakes, it has been found that increased levels of radon are detected in soil, in groundwater, and even in the air in people’s home basements. This precursor is presumed to be caused by the radon being released from cavities within the Earth’s crust as the crust is being strained prior to the sudden slippage (the earthquake). Earthquakes themselves can be precursors to serious events – specifically, a large earthquake detected at the bottom of the ocean can produce a massive tidal wave, that can travel across the ocean and have drastic consequences on distant shores. In some cases, the precursor can occur sufficiently in advance of the tidal wave’s predicted arrival at inhabited shores, thereby enabling early warnings to be broadcasted. In both of these cases, the precursor (radon release or ocean-based earthquake) is not the biggest problem, though they may be seen as sentinels of an on-going event, but the precursor is an early warning sign of a potentially bigger catastrophe that’s coming (a major land-based earthquake or a tidal wave hitting major population centers along coastlines, respectively).
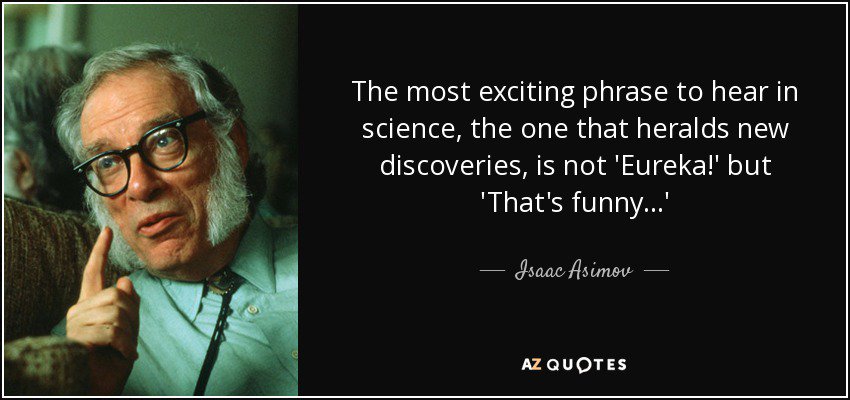
  • Cognitive – a cognitive person walking into an intense group meeting (perhaps a family or board meeting) can probably tell the mood of the room fairly quickly. The signals are there, though mostly contextual, thus probably missed by a cognitively impaired person. A cognitive person is curious about odd things that they see and hear—things or circumstances or behaviors that seem out of context, unusual, and surprising. The thing itself (or the data about the thing) may not be surprising (though it could be), but the context (the “metadata”, which is “other data about the primary data”) provides a signal that something needs attention here. Perhaps the simplest expression of being cognitive in this data-drenched world comes from a quote attributed to famous science writer Isaac Asimov: “The most exciting phrase to hear in science, the one that heralds new discoveries, is not ‘Eureka!’ (I found it!) but ‘That’s funny…‘.”

The cognitive enterprise versus the cognitively impaired enterprise – which of these would your organization prefer to be? Get moving now with sentinel, precursor, and cognitive analytics through data innovation and insights discovery with your on-prem enterprise data sources.

Read more about analytics innovation from on-prem enterprise data sources in this 3-part blog series:

  1. Solving the Data Daze – Analytics at the Speed of Business Questions
  2. The Data Space-Time Continuum for Analytics Innovation and Business Growth
  3. Delivering Low-Latency Analytics Products for Business Success

Low-Latency Data Delivery and Analytics Product Delivery for Business Innovation and Enterprise AI Readiness

This article has been divided into 2 parts now:

Read other articles in this series on the importance of low-latency enterprise data infrastructure for business analytics:

Other related articles on the importance of data infrastructure for enterprise AI initiatives:

The Data Space-Time Continuum for Analytics Innovation and Business Growth

We discussed in another article the key role of enterprise data infrastructure in enabling a culture of data democratization, data analytics at the speed of business questions, analytics innovation, and business value creation from those innovative data analytics solutions. Now, we drill down into some of the special characteristics of data and enterprise data infrastructure that ignite analytics innovation.

First, a little history – years ago, at the dawn of the big data age, there was frequent talk of the three V’s of big data (data’s three biggest challenges): volume, velocity, and variety. Though those discussions are now considered “ancient history” in the current AI-dominated era, the challenges have not vanished. In fact, they have grown in importance and impact.

While massive data volumes appear less frequently now in strategic discussions and are being tamed with excellent data infrastructure solutions from Pure Storage, the data velocity and data variety challenges remain in their own unique “sweet spot” of business data strategy conversations. We addressed the data velocity challenges and solutions in our previous article: “Solving the Data Daze – Analytics at the Speed of Business Questions”. We will now take a look at the data variety challenge, and then we will return to modern enterprise data infrastructure solutions for handling all big data challenges.

Okay, data variety—what is there about data variety that makes it such a big analytics challenge? This challenge often manifests itself when business executives ask a question like this: “what value and advantages will all that diversity in data sources, venues, platforms, modalities, and dimensions actually deliver for us in order to outweigh the immense challenges that high data variety brings to our enterprise data team?”

Because nearly all organizations collect many types of data from many different sources for many business use cases, applications, apps, and development activities, consequently nearly every organization is facing this dilemma.

[continue reading the full article here]

Data Insights for Everyone — The Semantic Layer to the Rescue

What is a semantic layer? That’s a good question, but let’s first explain semantics. The way that I explained it to my data science students years ago was like this. In the early days of web search engines, those engines were primarily keyword search engines. If you knew the right keywords to search and if the content providers also used the same keywords on their website, then you could type the words into your favorite search engine and find the content you needed. So, I asked my students what results they would expect from such a search engine if I typed the following words into the search box: “How many cows are there in Texas?” My students were smart. They realized that the search results would probably not provide an answer to my question, but the results would simply list websites that included my words on the page or in the metadata tags: “Texas”, “Cows”, “How”, etc. Then, I explained to my students that a semantic-enabled search engine (with a semantic meta-layer, including ontologies and similar semantic tools) would be able to interpret my question’s meaning and then map that meaning to websites that can answer the question.

This was a good opening for my students to the wonderful world of semantics. I brought them deeper into the world by pointing out how much more effective and efficient the data professionals’ life would be if our data repositories had a similar semantic meta-layer. We would be able to go far beyond searching for correctly spelled column headings in databases or specific keywords in data documentation, to find the data we needed (assuming we even knew the correct labels, metatags, and keywords used by the dataset creators). We could search for data with common business terminology, regardless of the specific choice or spelling of the data descriptors in the dataset. Even more than that, we could easily start discovering and integrating, on-the-fly, data from totally different datasets that used different descriptors. For example, if I am searching for customer sales numbers, different datasets may label that “sales”, or “revenue”, or “customer_sales”, or “Cust_sales”, or any number of other such unique identifiers. What a nightmare that would be! But what a dream the semantic layer becomes!

When I was teaching those students so many years ago, the semantic layer itself was just a dream. Now it is a reality. We can now achieve the benefits, efficiencies, and data superhero powers that we previously could only imagine. But wait! There’s more.

Perhaps the greatest achievement of the semantic layer is to provide different data professionals with easy access to the data needed for their specific roles and tasks. The semantic layer is the representation of data that helps different business end-users discover and access the right data efficiently, effectively, and effortlessly using common business terms. The data scientists need to find the right data as inputs for their models — they also need a place to write-back the outputs of their models to the data repository for other users to access. The BI (business intelligence) analysts need to find the right data for their visualization packages, business questions, and decision support tools — they also need the outputs from the data scientists’ models, such as forecasts, alerts, classifications, and more. The semantic layer achieves this by mapping heterogeneously labeled data into familiar business terms, providing a unified, consolidated view of data across the enterprise.

The semantic layer delivers data insights discovery and usability across the whole enterprise, with each business user empowered to use the terminology and tools that are specific to their role. How data are stored, labeled, and meta-tagged in the data cloud is no longer a bottleneck to discovery and access. The decision-makers and data science modelers can fluidly share inputs and outputs with one another, to inform their role-specific tasks and improve their effectiveness. The semantic layer takes the user-specific results out of being a “one-off” solution on that user’s laptop to becoming an enterprise analytics accelerant, enabling business answer discovery at the speed of business questions.

Insights discovery for everyone is achieved. The semantic layer becomes the arbiter (multi-lingual data translator) for insights discovery between and among all business users of data, within the tools that they are already using. The data science team may be focused on feature importance metrics, feature engineering, predictive modeling, model explainability, and model monitoring. The BI team may be focused on KPIs, forecasts, trends, and decision-support insights. The data science team needs to know and to use that data which the BI team considers to be most important. The BI team needs to know and to use which trends, patterns, segments, and anomalies are being found in those data by the data science team. Sharing and integrating such important data streams has never been such a dream.

The semantic layer bridges the gaps between the data cloud, the decision-makers, and the data science modelers. The key results from the data science modelers can be written back to the semantic layer, to be sent directly to consumers of those results in the executive suite and on the BI team. Data scientists can focus on their tools; the BI users and executives can focus on their tools; and the data engineers can focus on their tools. The enterprise data science, analytics, and BI functions have never been so enterprisey. (Is “enterprisey” a word? I don’t know, but I’m sure you get my semantic meaning.)

That’s empowering. That’s data democratization. That’s insights democratization. That’s data fluency/literacy-building across the enterprise. That’s enterprise-wide agile curiosity, question-asking, hypothesizing, testing/experimenting, and continuous learning. That’s data insights for everyone.

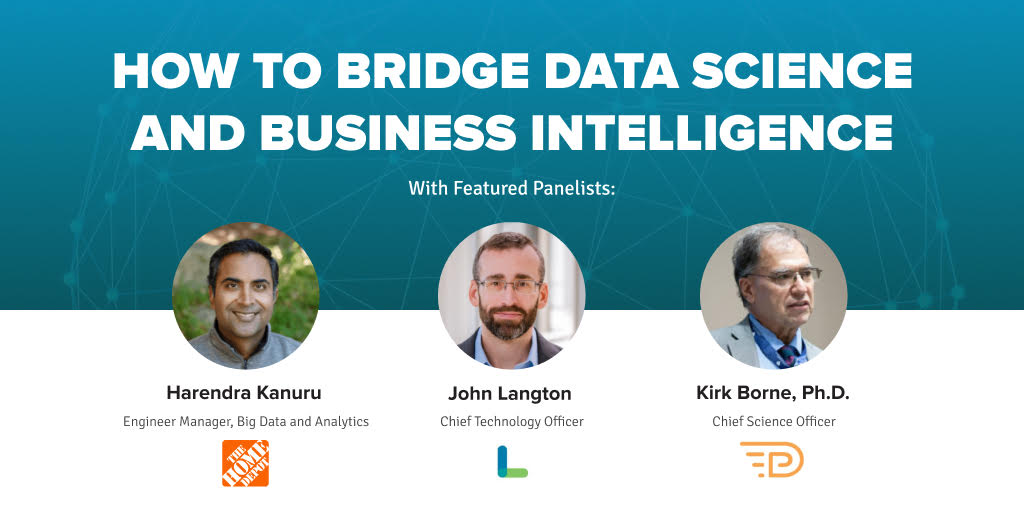
Are you ready to learn more how you can bring these advantages to your organization? Be sure to watch the AtScale webinar “How to Bridge Data Science and Business Intelligence” where I join a panel in a multi-industry discussion on how a semantic layer can help organizations make smarter data-driven decisions at scale. There will be several speakers, including me. I will be speaking about “Model Monitoring in the Enterprise — Filling the Gaps”, specifically focused on “Filling the Communication Gaps Between BI and Data Science Teams With a Semantic Data Layer.”

Register to attend and view the webinar at https://bit.ly/3ySVIiu.

https://bit.ly/3ySVIiu

Analytics Insights and Careers at the Speed of Data

How to make smarter data-driven decisions at scale: http://bit.ly/3rS3ZQW

The determination of winners and losers in the data analytics space is a much more dynamic proposition than it ever has been. One CIO said it this way, “If CIOs invested in machine learning three years ago, they would have wasted their money. But if they wait another three years, they will never catch up.”  Well, that statement was made five years ago! A lot has changed in those five years, and so has the data landscape.

The dynamic changes of the business requirements and value propositions around data analytics have been increasingly intense in depth (in the number of applications in each business unit) and in breadth (in the enterprise-wide scope of applications in all business units in all sectors). But more significant has been the acceleration in the number of dynamic, real-time data sources and corresponding dynamic, real-time analytics applications.

We no longer should worry about “managing data at the speed of business,” but worry more about “managing business at the speed of data.”

One of the primary drivers for the phenomenal growth in dynamic real-time data analytics today and in the coming decade is the Internet of Things (IoT) and its sibling the Industrial IoT (IIoT). With its vast assortment of sensors and streams of data that yield digital insights in situ in almost any situation, the IoT / IIoT market has a projected market valuation of $1.5 trillion by 2030. The accompanying technology Edge Computing, through which those streaming digital insights are extracted and then served to end-users, has a projected valuation of $800 billion by 2028.

With dynamic real-time insights, this “Internet of Everything” can then become the “Internet of Intelligent Things”, or as I like to say, “The Internet used to be a thing. Now things are the Internet.” The vast scope of this digital transformation in dynamic business insights discovery from entities, events, and behaviors is on a scale that is almost incomprehensible. Traditional business analytics approaches (on laptops, in the cloud, or with static datasets) will not keep up with this growing tidal wave of dynamic data.

Another dimension to this story, of course, is the Future of Work discussion, including creation of new job titles and roles, and the demise of older job titles and roles. One group has declared, “IoT companies will dominate the 2020s: Prepare your resume!” This article quotes an older market projection (from 2019), which estimated “the global industrial IoT market could reach $14.2 trillion by 2030.”

In dynamic data-driven applications, automation of the essential processes (in this case, data triage, insights discovery, and analytics delivery) can give a power boost to ride that tidal wave of fast-moving data streams. One can prepare for and improve skill readiness for these new business and career opportunities in several ways:

  • Focus on the automation of business processes: e.g., artificial intelligence, robotics, robotic process automation, intelligent process automation, chatbots.
  • Focus on the technologies and engineering components: e.g., sensors, monitoring, cloud-to-edge, microservices, serverless, insights-as-a-service APIs, IFTTT (IF-This-Then-That) architectures.
  • Focus on the data science: e.g., machine learning, statistics, computer vision, natural language understanding, coding, forecasting, predictive analytics, prescriptive analytics, anomaly detection, emergent behavior discovery, model explainability, trust, ethics, model monitoring (for data drift and concept drift) in dynamic environments (MLOps, ModelOps, AIOps).
  • Focus on specific data types: e.g., time series, video, audio, images, streaming text (such as social media or online chat channels), network logs, supply chain tracking (e.g., RFID), inventory monitoring (SKU / UPC tracking).
  • Focus on the strategies that aim these tools, talents, and technologies at reaching business mission and goals: e.g., data strategy, analytics strategy, observability strategy (i.e., why and where are we deploying the data-streaming sensors, and what outcomes should they achieve?).

Insights discovery from ubiquitous data collection (via the tens of billions of connected devices that will be measuring, monitoring, and tracking nearly everything internally in our business environment and contextually in the broader market and global community) is ultimately about value creation and business outcomes. Embedding real-time dynamic analytics at the edge, at the point of data collection, or at the moment of need will dynamically (and positively) change the slope of your business or career trajectory. Dynamic sense-making, insights discovery, next-best-action response, and value creation is essential when data is being acquired at an enormous rate. Only then can one hope to realize the promised trillion-dollar market value of the Internet of Everything.

For more advice, check out this upcoming webinar panel discussion, sponsored by AtScale, with data and analytics leaders from Wayfair, Cardinal Health, bol.com, and Slickdeals: “How to make smarter data-driven decisions at scale.” Each panelist will share an overview of their data & analytics journey, and how they are building a self-service, data-driven culture that scales. Join us on Wednesday, March 31, 2021 (11:00am PT | 2:00pm ET). Save your spot here: http://bit.ly/3rS3ZQW. I hope that you find this event useful. And I hope to see you there!

Please follow me on LinkedIn and follow me on Twitter at @KirkDBorne.

How We Teach The Leaders of Tomorrow To Be Curious, Ask Questions and Not Be Afraid To Fail Fast To Learn Fast

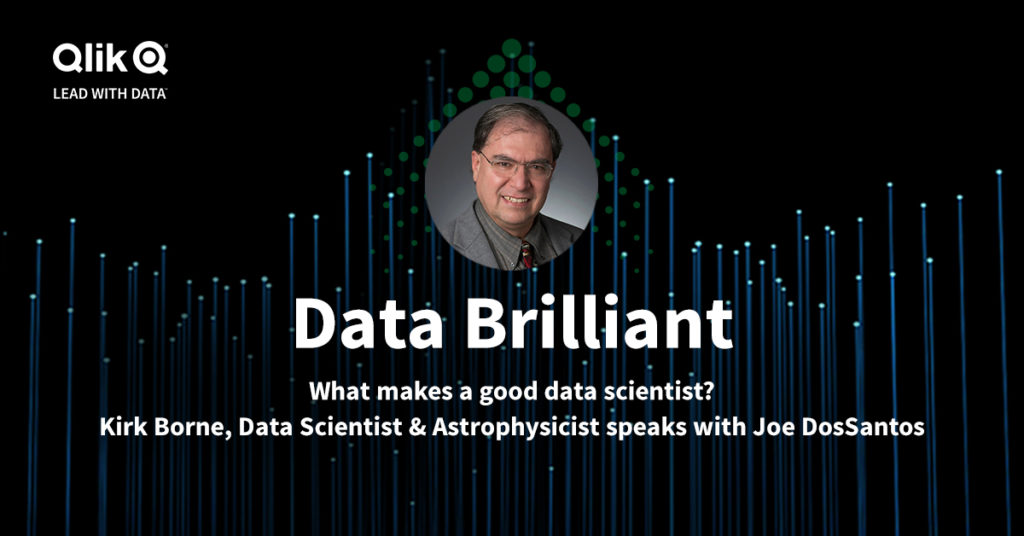
I recently enjoyed recording a podcast with Joe DosSantos (Chief Data Officer at Qlik). This was one in a series of #DataBrilliant podcasts by Qlik, which you can also access here (Apple Podcasts) and here (Spotify). I summarize below some of the topics that Joe and I discussed in the podcast. Be sure to listen to the full recording of our lively conversation, which covered Data Literacy, Data Strategy, Data Leadership, and more.

The Age of Hype Cycles

The data age has been marked by numerous “hype cycles.” First, we heard how Big Data, Data Science, Machine Learning (ML) and Advanced Analytics would have the honor to be the technologies that would cure cancer, end world hunger and solve the world’s biggest challenges. Then came third-generation Artificial Intelligence (AI), Blockchain and soon Quantum Computing, with each one seeking that honor.

From all this hope and hype, one constant has always been there: a focus on value creation from data. As a scientist, I have always recommended a scientific approach: State your problem first, be curious (ask questions), collect facts to address those questions (acquire data), investigate, analyze, ask more questions, include a sensible serving of skepticism, and (above all else) aim to fail fast in order to learn fast. As I discussed with Joe DosSantos when I spoke with him for the latest episode of Data Brilliant, you don’t need to be a data scientist to follow these principles. These apply to everyone, in all organizations and walks of life, in every sector.

One characteristic of science that is especially true in data science and implicit in ML is the concept of continuous learning and refining our understanding. We build models to test our understanding, but these models are not “one and done.” They are part of a cycle of learning. In ML, the learning cycle is sometimes called backpropagation, where the errors (inaccurate predictions) of our models are fed back into adjusting the model’s input parameters in a way that aims to improve the output accuracy. A more colloquial expression for this is: good judgment comes from experience, and experience comes from bad judgment.

Data Literacy For All

I know that for some, the term data and some of the other terminology I’ve mentioned already can be scary. But they shouldn’t be. We are all surrounded by – and creating – masses of data every single day. As Joe and I talked about, one of the first hurdles in data literacy is getting people to recognize that everything is data. What you see with your eyes? That’s data. What you hear with your ears? Data. The words that come out of your mouth that other people hear? That’s all data. Images, text, documents, audio, video and all the apps on your phone, all the things you search for on the internet? Yet again, that’s data.

Every single day, everyone around the world is using data and the principles I mention above, many without realizing it. So, now we need to bring this value to our businesses.

How To Build A Successful Enterprise Data Strategy

In my chat with Joe, we talked about many data concepts in the context of enterprise digital transformation. As always, but especially during the race toward digital transformation that has been accelerated by the 2020 pandemic, a successful enterprise data strategy that leads to business value creation can benefit from first addressing these six key questions:

(1) What mission objective and outcomes are you aiming to achieve?

(2) What is the business problem, expressed in data terminology? Specifically, is it a detection problem (fraud or emergent behavior), a discovery problem (new customers or new opportunities), a prediction problem (what will happen) or an optimization problem (how to improve outcomes)?

(3) Do you have the talent (key people representing diverse perspectives), tools (data technologies) and techniques (AI and ML knowledge) to make it happen?

(4) What data do you have to fuel the algorithms, the training and the modeling processes?

(5) Is your organizational culture ready for this (for data-informed decisions; an experimentation mindset; continuous learning; fail fast to learn fast; with principled AI and data governance)?

(6) What operational technology environment do you have to deploy the implementation (cloud or on-premise platform)?

Data Leadership

As Joe and I discussed, your ultimate business goal is to build a data-fueled enterprise that delivers business value from data. Therefore, ask questions, be purposeful (goal-oriented and mission-focused), be reasonable in your expectations and remain reasonably skeptical – because as famous statistician, George Box, once said “all models are wrong, but some are useful.”

Now, listen to the full podcast here.

Data Science Blogs-R-Us

[UPDATED December 31, 2022]

I have written articles in many places. I will be collecting links to those sources here. The list is not complete and will be constantly evolving. There are some older blogs that I will be including in the list below as I remember them and find them. Also included are some interviews in which I provided detailed answers to a variety of questions.

In 2019, I was listed as the #1 Top Data Science Blogger to Follow on Twitter.

And then there’s this — not a blog, but a link to my 2013 TedX talk: “Big Data, Small World.” (Many more videos of my talks are available online. That list will be compiled in another place soon.)

  1. Rocket-Powered Data Science (the website that you are now reading).
  2. https://medium.com/@kirk.borne
  3. https://www.the-yuan.com/search.html (Search for “Kirk Borne” blogs)
  4. https://www.datasciencecentral.com/author/kirkborne/
  5. https://medium.com/@relx/ai-adoption-in-2021-driven-by-many-external-factors-af5b848cee33
  6. https://muckrack.com/kirk-borne/articles
  7. https://www.govloop.com/author/kirkdborne/
  8. https://datamakespossible.westerndigital.com/tag/kirk-borne/
  9. https://www.linkedin.com/in/kirkdborne/detail/recent-activity/posts/
  10. https://www.linkedin.com/pulse/how-go-from-data-paradox-productivity-business-kirk-borne-ph-d-/
  11. https://blog.starburst.io/author/kirk-borne
  12. https://www.oreilly.com/people/kirk-borne/
  13. https://www.syntasa.com/blog/author/kirk-borne
  14. https://mapr.com/blog/author/kirk-borne/
  15. https://asistdl.onlinelibrary.wiley.com/doi/full/10.1002/bult.2013.1720390414
  16. https://www.thedatadreamer.com/insights/talk-the-walk-the-importance-of-fluency-in-data-storytelling/
  17. https://www.futureofbusinessandtech.com/business-ai/leveraging-artificial-intelligence-for-social-good/
  18. https://mindsdb.com/blog/predictions-at-the-speed-of-questions/?utm_source=kirk&utm_medium=blog&utm_campaign=wb
  19. https://blog.qlik.com/how-we-teach-the-leaders-of-tomorrow-to-be-curious-ask-questions-and-not-be-afraid-to-fail-fast-to-learn-fast
  20. https://www.boozallen.com/s/insight/blog/kirk-borne-on-building-data-science-models.html
  21. https://www.boozallen.com/s/insight/blog/the-power-of-data-science-and-ai-for-social-good.html
  22. https://odsc.com/blog/adapting-machine-learning-algorithms-to-novel-use-cases/
  23. https://www.kdnuggets.com/2019/01/data-scientist-dilemma-cold-start-machine-learning.html
  24. https://www.sas.com/en_us/insights/articles/analytics/data-scientist-data-literacy.html
  25. https://blogs.sas.com/content/sascom/2019/04/27/getting-practical-about-ai-with-kirk-borne/
  26. https://blogs.sas.com/content/sascom/2017/08/31/3-machine-learning-technologies-3-three-years/
  27. https://www.digitalistmag.com/future-of-work/2019/05/15/intelligent-enterprise-connecting-islands-of-innovation-06198471
  28. https://www.digitalistmag.com/cio-knowledge/2019/06/27/data-strategy-that-first-date-with-your-data-06199224
  29. https://blogs.oracle.com/author/kirk-borne
  30. https://blogs.thomsonreuters.com/answerson/doing-better-at-your-service-with-ai-as-a-service/
  31. https://www.aitimejournal.com/data-science-interview-with-kirk-borne-principal-data-scientist-booz-allen-hamilton
  32. https://insideanalysis.com/author/kirk-borne/
  33. http://researcher123.blogspot.com/2014/
  34. https://www.manthan.com/blogs/nrf-interview-with-kirk-borne-big-data-hype-the-worst-is-behind-us/
  35. https://www.thinkful.com/blog/meet-the-experts-dr-kirk-borne/
  36. https://itpeernetwork.intel.com/author/kirkborne/#gs.6zd0x8
  37. https://www.ibmbigdatahub.com/blog/author/kirk-borne
  38. https://www.laserfiche.com/ecmblog/3-questions-kirk-borne-about-big-data/

The Power of Graph Databases, Linked Data, and Graph Algorithms

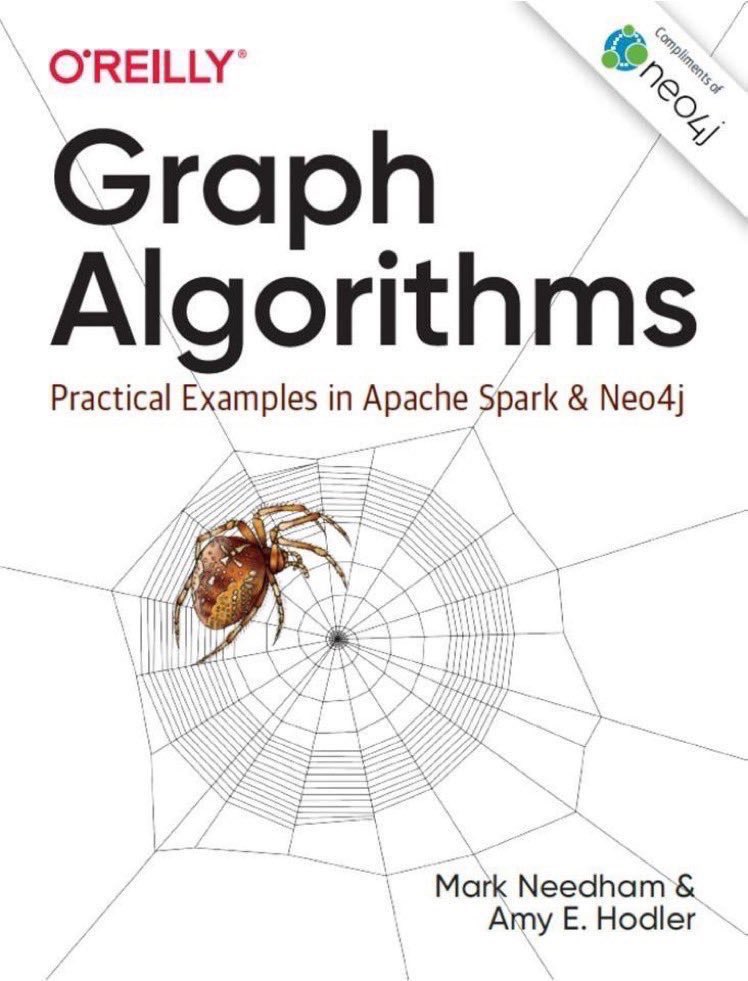
In 2019, I was asked to write the Foreword for the book Graph Algorithms: Practical Examples in Apache Spark and Neo4j, by Mark Needham and Amy E. Hodler. I wrote an extensive piece on the power of graph databases, linked data, graph algorithms, and various significant graph analytics applications. In their wisdom, the editors of the book decided that I wrote “too much”. So, they correctly shortened my contribution by about half in the final published version of my Foreword for the book.

The book is awesome, an absolute must-have reference volume, and it is free (for now, downloadable from Neo4j).

Graph Algorithms book

Now, for the first time, the full unabridged (and unedited) version of my initial contribution as the Foreword for the book is published here. (You should still get the book because it is a fantastic 250-page masterpiece for data scientists!) Any omissions, errors, or viewpoints in the piece below are entirely my own. I publish this in its original form in order to capture the essence of my point of view on the power of graph analytics.

As you read this, just remember the most important message: the natural data structure of the world is not rows and columns, but a graph. And this: perhaps the most powerful node in a graph model for real-world use cases might be “context”. How does one express “context” in a data model? Ahh, that’s the topic for another article. But this might help you get there: https://twitter.com/KirkDBorne/status/1232094501537275904

“All the World’s a Graph”

What do marketing attribution analysis, anti-money laundering, customer journey modeling, safety incident causal factor analysis, literature-based discovery, fraud network analysis, Internet search, the map app on your mobile phone, the spread of infectious diseases, and the theatrical performance of a William Shakespeare play all have in common? No, it is not something as trivial as the fact that all these phrases contain nouns and action verbs! What they have in common is that all these phrases proved that Shakespeare was right when he declared, “All the world’s a graph!”

Okay, the Bard of Avon did not actually say “Graph” in that sentence, but he did say “Stage” in the sentence. However, notice that all the examples mentioned above involve entities and the relationships between them, including both direct and indirect (transitive) relationships — a graph! Entities are the nodes in the graph — these can be people, events, objects, concepts, or places. The relationships between the nodes are the edges in the graph. Therefore, isn’t the very essence of a Shakespearean play the live action portrayal of entities (the nodes) and their relationships (the edges)? Consequently, maybe Shakespeare could have said “Graph” in his famous declaration.

What makes graph algorithms and graph databases so interesting and powerful isn’t the simple relationship between two entities: A is related to B. After all, the standard relational model of databases instantiated these types of relationships in its very foundation decades ago: the ERD (Entity-Relationship Diagram). What makes graphs so remarkably different and important are directional relationships and transitive relationships. In directional relationships, A may cause B, but not the opposite. In transitive relationships, A can be directly related to B and B can be directly related to C, while A is not directly related to C, so that consequently A is transitively related to C.

Because of transitivity relationships, particularly when they are numerous and diverse with many possible relationship (network) patterns and many possible degrees of separation between the entities, the graph model enables discovery of relationships between two entities that otherwise may seem wholly disconnected, unrelated, and difficult (if not impossible) to discover in a relational database. Hence, the graph model can be applied productively and effectively in numerous network analysis use cases.

Consider this marketing attribution use case: person A sees the marketing campaign, person A talks about it on their social media account, person B is connected to person A and sees the comment, and subsequently person B buys the product. From the marketing campaign manager’s perspective, the standard relational model would fail to identify the attribution, since B did not see the campaign and A did not respond to the campaign. The campaign looks like a failure. But it is not a failure — its actual success (and positive ROI) is discovered by the graph analytics algorithm through the transitive relationship between the marketing campaign and the final customer purchase, through an intermediary (entity-in-the-middle)!

Next, consider the anti-money laundering (AML) use case: person A and person C are under suspicion for illicit trafficking. Any interaction between the two (e.g., a financial transaction in a financial database) would be flagged by the authorities, and the interactions would come under great scrutiny. However, if A and C never transact any business together, but instead conduct their financial dealings through a safe, respected, unflagged financial authority B, then who would ever notice the transaction? Well, the graph analytics algorithm would notice! The graph engine would discover that there was a transitive relationship between A and C through the intermediary B (the entity-in-the-middle).

Similar descriptions of the power of graph can be given for the other use cases mentioned in the opening paragraph above, all of which are examples of network analysis through graph algorithms. Each of those cases deeply involves entities (people, objects, events, actions, concepts, and places) and their relationships (touch points, both causal and simple associations). Because of their great interest and power, we highlight two more of those use cases: Internet search and Literature-Based Discovery (LBD).

In Internet search a hyperlinked network (graph-based) algorithm is used by a major search engine to find the central authoritative node across the entire Internet for any given set of search words. The directionality of the edge is most important in this use case since the authoritative node in the network is the one that many other nodes point toward.

LBD is a knowledge network (graph-based) application in which significant discoveries are enabled across the knowledgebase of thousands (and even millions) of research journal articles — the discovery of “hidden knowledge” is only made through the connection between two published research results that may have a large number of degrees of separation (transitive relationships) between them. LBD is being applied to cancer research studies, where the massive semantic medical knowledgebase of symptoms, diagnoses, treatments, drug interactions, genetic markers, short-term results, and long-term consequences may be “hiding” previously unknown cures or beneficial treatments of the most impenetrable cases. The knowledge is already in the network, if only we were to connect the dots to discover it.

The book Graph Algorithms: Practical Examples in Apache Spark and Neo4j is aimed at broadening our knowledge and capabilities around these types of graph analyses, including algorithms, concepts, and practical machine learning applications of the algorithms. From basic concepts to fundamental algorithms, to processing platforms and practical use cases, the authors have compiled an instructive and illustrative guide to the wonderful world of graphs.

Chapter 1 provides a beautiful introduction to graphs, graph analytics algorithms, network science, and graph analytics use cases. In the discussion of power-law distributions, we see again another way that graphs differ from more familiar statistical analyses that assume a normal distribution of properties in random populations. Prepare yourself for some unexpected insights when you realize that power-law distributions are incredibly common in the natural world — graph analytics is a great tool for exploring those scale-free structures and their long tails. By the way, I always love a discussion that mentions the Pareto distribution.

Chapter 2 steps up our graph immersion by introducing us to the many different types of graphs that represent the rich variety of informative relationships that can exist between nodes, including directed and undirected, cyclic and acyclic, trees, and more. If you have always wondered what a DAG was, now you have no more excuses for not knowing. It’s all here. The chapter ends with a quick summary of things to come in greater detail in future chapters, by defining the three major categories of graph algorithms: pathfinding, centrality, and community detection.

Chapter 3 focuses on the graph processing platforms that are mentioned in the subtitle to the book: Apache Spark and Neo4j. In the Apache Spark section, you will find information about the Spark Graph Project, GraphFrames, and Cypher (the graph query language). In the Neo4j section, you will learn about its APOC library: Awesome Procedures On Cypher. Brief instructions on installing these graph engines are included, to prepare you for the use cases and sample applications that are provided later in the book.

Chapters 4, 5, and 6 then dive into the three major graph algorithm categories mentioned earlier. For example, the map app on your mobile phone employs a version of the pathfinding algorithm. Root cause analysis, customer journey modeling, and the spread of infectious diseases are other example applications of pathfinding. Internet search and influencer detection in social networks are example applications of the centrality algorithm. Fraud network analysis, AML, and LBD are example applications of community detection.

Marketing attribution is a use case that may productively incorporate applications of all three graph analytics algorithm categories, depending on the specific question being asked: (1) how did the marketing message flow from source to final action? (pathfinding); (2) was there a dominant influencer who initiated the most ROI from the marketing campaign? (centrality); or (3) is there a community (a set of common personas) that are most responsive to the marketing campaign? (community detection).

Let’s not forget one more example application — a well-conceived theatrical masterpiece will almost certainly be an instantiation of community detection (co-conspirators, love triangles, and all that). That masterpiece will undoubtedly include a major villain or a central hero (representing centrality). Such a masterpiece is probably also a saga (the story of a journey), containing intrigues, strategies, and plots that move ingeniously, methodically, and economically (in three acts or less) toward some climactic ending (thus representing pathfinding).

In Chapter 7, we find many code samples for example applications of graph algorithms, thus rendering all the above knowledge real and useful to the reader. In this manner, the book becomes an instructional tutorial as well as a guide on the side. Putting graph algorithms into practice through these examples is one of the most brilliant contributions of this book — giving you the capability to do it for yourself and to start reaping the rewards of exploring the most natural data structure to describe the world: not rows and columns, but a graph! You will be able to connect the dots that aren’t connected in traditional data structures, build a knowledge graph, explore the graph for insights, and exploit it for value. Let’s put this another way: your graph-powered team will be able to increase the value of your organization’s data assets in ways that others may not have ever imagined. Your team will become graph heroes.

Finally, in Chapter 8, the connection between graph algorithms and machine learning that was implicit throughout the book now becomes explicit. The training data and feature sets that feed machine learning algorithms can now be immensely enriched with tags, labels, annotations, and metadata that were inferred and/or provided naturally through the transformation of your repository of data into a graph of data. Any node and its relationship to a particular node becomes a type of contextual metadata for that particular note. All of that “metadata” (which is simply “other data about your data”) enables rich discovery of shortest paths, central nodes, and communities.

Graph modeling of your data set thus enables more efficient and effective feature extraction and selection (also described in Chapter 8), as the graph exposes the most important, influential, representative, and explanatory attributes to be included in machine learning models that aim to predict a particular target outcome variable as accurately as possible.

When considering the power of graph, we should keep in mind that perhaps the most powerful node in a graph model for real-world use cases might be “context”, including the contextual metadata that we already mentioned. Context may include time, location, related events, nearby entities, and more. Incorporating context into the graph (as nodes and as edges) can thus yield impressive predictive analytics and prescriptive analytics capabilities.

When all these pieces and capabilities are brought together, the graph analytics engine is thereby capable of exploring deep relationships between events, actions, people, and other things across both spatial and temporal (as well as other contextual) dimensions. Consequently, a graph algorithm-powered analysis tool may be called a Spatial-Temporal Analytics Graph Engine (STAGE!). Therefore, if Shakespeare was alive today, maybe he would agree with that logic and would still say “All the world’s a STAGE.” In any case, he would want to read this book to learn how to enrich his stories with deeper insights into the world and with more interesting relationships.

Top 10 Conversations That You Do Not Want to Have on Data Innovation Day

[Note: this post is a slightly modified version of an earlier post. Although written with light (perhaps weak) humor, this post was created to bring attention to the Benefits of Open Data for innovation, value creation, and digital transformation on Open Data Day.]

Data Innovation is a powerful strategic goal for data-intensive organizations, especially to be celebrated through Data Innovation Day events, whenever they may occur. Here are the top 10 conversations that you do not want to have on that day. Let the countdown begin….

10.  CDO (Chief Data Officer) speaking to Data Innovation Day event manager who is trying to re-schedule the event for Father’s Day: “Don’t do that! It’s pronounced ‘Day-tuh’, not ‘Dadda’.”

9.  CDO speaking at the company’s Data Innovation Day event regarding an acronym that was used to abbreviate his job title in the event program guide: “I am the company’s Big Data ‘As A Service’ guru, not the company’s Bigdata ‘As Software Service’ guru.”  (Hint: that’s BigData-aaS, not Big-aSS)

8.  Data Scientist speaking to Data Innovation Day session chairperson: “Why are all of these cowboys on stage with me? I said I was planning to give a LASSO demonstration.”

​7.  Any person speaking to you: “Our organization has always done big data.”

6.  You speaking to any person: “Seriously? … The title of our Data Innovation Day Event is ‘Big Data is just Small Data, Only Bigger’.

5.  New cybersecurity administrator (fresh from college) sends this e-mail to company’s Data Scientists at 4:59pm on Friday: “The security holes in our data-sharing platform are now fixed. It will now automatically block all ports from accepting incoming data access requests between 5:00pm today and 9:00am Monday.  Gotta go now.  Have a nice weekend.  From your new BFF.”

4.  Data Scientist speaking to new Human Resources Department Analytics ​Specialist regarding the truckload of tree seedlings that she received as her end-of-year company bonus:  “I said in my employment application that I like Decision Trees, not Deciduous Trees.”

3.  Organizer for the huge Las Vegas Data Innovation Day Symposium speaking to the conference keynote speaker: “Oops, sorry. I blew your $100,000 speaker’s honorarium at the poker tables in the Grand Casino.”

2.  Over-zealous cleaning crew speaking to the Data Center Manager as she is arriving for work in the morning after Data Innovation Day event that was held in the company’s shiny new Exascale Data Center: “We did a very thorough job cleaning your data center. And we won’t even charge you for the extra hours that we spent wiping the disk drives clean and deleting all the dirty data that you kept talking about yesterday.”

1.  Announcement to University staff regarding the Data Innovation Day event:  “Dan Ariely’s keynote talk ‘Big Data is Like Teenage Sex‘ is being moved from basement room B002 in the Physics Department to the Campus Football Stadium due to overwhelming student interest.”

Follow Kirk Borne on Twitter @KirkDBorne