Pure Storage empowers enterprise AI with advanced data storage technologies and validated reference architectures for emerging generative AI use cases.
Summary
AI devours data. With award-winning AI-ready infrastructure, an AI data platform, and collaboration with NVIDIA, Pure Storage is delivering solutions and services that enable organizations to manage the high-performance data and compute requirements of enterprise AI.
AI Then and AI Now
They (some wise anonymous folks out there) say that there is a time and place for everything. They also say there is a season for every purpose. I believe that the time, place, and season for artificial intelligence (AI) data platforms have arrived. To see this, look no further than Pure Storage, whose core mission is to “empower innovators by simplifying how people consume and interact with data.”
In the past, it was sufficient to bring order to the randomness of enterprise data collection through applications of technology resources (databases and storage devices) that were aimed primarily at organizing, storing, indexing, and managing enterprise information assets for single purposes or single business units. However, this data was still left mostly unexploited for its maximum potential and enterprise-wide business value.
Also in the past, it was sufficient for business automation to consist primarily of rigid rule-based robotic non-adaptive repetition of processes and fixed tasks, requiring very little (if any) new knowledge input (i.e., live data consumption) or real-time adaptation to changing business conditions.
And also in the past, it was sufficient for AI to be relegated to academic researchers or R&D departments of big organizations who mostly produced research reports or journal papers, and not much else.
Fast-forward to 2024 and we see a totally different landscape: massive data sets feeding dynamic cross-enterprise processes, increasing automation and dynamic adaption of complex multi-step tasks, and ubiquitous value-producing applications of AI. In particular, in the past year, generative AI has played a major role in the explosive development and growth of these transformations within enterprises.
Pure Storage Meets the Demands of Enterprise AI
To support, sustain, and assure the continued success and cost-effectiveness of the enormous data-fueled AI-powered transformations in such a rapidly changing environment, Pure Storage has stepped up their delivery of an incredible array of award-winning AI-ready infrastructure (AIRI//S™) products and services with an AI data platform that provides the fundamental AI environment for enterprise data management (storage, access, orchestration, delivery), hyperscaled AI training, and AI inference on demand (on-prem, in data centers, at edge sites, and in micro edge devices).
One example of Pure Storage’s advantage in meeting AI’s data infrastructure requirements is demonstrated in their DirectFlash® Modules (DFMs), with an estimated lifespan of 10 years and with super-fast flash storage capacity of 75 terabytes (TB) now, to be followed up with a roadmap that is planning for capacities of 150TB, 300TB, and beyond. Another example is Pure Storage’s FlashBlade® which was invented to help companies handle the rapidly increasing amount of unstructured data coming into greater use, as required in the training of multi-modal AI models. One more example is Pure Storage’s development of non-disruptive upgrades (NDUs), a feature of Pure Storage’s architecture that permits upgrades and expansion of the data infrastructure with no impact on data availability or performance, and with no downtime or data migrations.
Pure Storage’s Announcements at GTC 2024
The preceding examples are industry-leading and exemplary, and yet there’s still more. At the NVIDIA GTC 2024 conference, Pure Storage announced so much more! Here are a few more details on some of those announcements.
A Data Platform for AI
Data is the fuel for AI, because AI devours data—finding patterns in data that drive insights, decisions, and action. Ease of data orchestration (ingest, cleaning, transformation, discovery, access, exploration, delivery, training, inference, deployment) is essential for data-devouring AI products and services. A data platform for AI is key to innovation and long-term affordability, scalability, sustainability, and advancement of enterprise AI applications. Anything less than a complete data platform for AI is a deal-breaker for enterprise AI. Pure Storage provides the ideal data platform for AI, as it provides unified storage for structured and unstructured data and provides enterprise data services for Kubernetes, supporting the entire AI data pipeline, because storage matters!
At GTC 2024, Pure demonstrated the features of their data platform for AI, specifically highlighting these benefits and features of the platform: (a) Helps organizations accelerate model training and inference; (b) Improves operational efficiency for AI/IT infrastructure teams, as well as AI/ML developers and engineers; (c) Delivers cost and energy efficiency as an enterprise scales their AI operations; and (d) Provides an AI storage platform that delivers ultimate reliability and is built to handle all future AI storage needs.
Optimizing GenAI Apps with RAG—Pure Storage + NVIDIA for the Win!
One of the most popular techniques associated with generative AI (GenAI) this past year has been retrieval-augmented generation (RAG). RAG is the essential link between two things: (a) the general large language models (LLMs) available in the market, and (b) a specific organization’s local knowledge base. In deep learning applications (including GenAI, LLMs, and computer vision), a data object (e.g., document, image, video, audio clip) is reduced (transformed) to a condensed vector representation using deep neural networks. The knowledge base then becomes the comprehensive collection of these condensed representations of the enterprise business data repositories, stored in vector format in a vector database—Vector DB being another major data technology development finding widespread adoption this past year.
As a consequence of these activities, RAG provides the bespoke use case-specific context to an organization’s proprietary GenAI LLM applications. This contextualization of the GenAI LLM is not only enterprise-specific, local, and customized, but it is also proprietary—maintaining the privacy and security of the GenAI LLM application within the security firewalls and policies of that organization. Additionally, RAG ensures the use of an organization’s most recent data while eliminating the need for constant retraining of the LLMs. Pure Storage has worked with NVIDIA (GPU memory and GPU servers) to boost the speed, accuracy, and on-prem power of such enterprise GenAI LLM applications. Here are some specific documented results:
(a) “NVIDIA GPUs are used for compute and Pure Storage FlashBlade//S provides all-flash enterprise storage for a large vector database and its associated raw data. In a specific case [presented at GTC], the raw data consisted of a large collection of public documents, typical of a public or private document repository used for RAG.”
Pure Storage’s RAG pipeline, in conjunction with NVIDIA GPUs and NVIDIA’s NeMo Retriever collection of GenAI microservices, ensures accuracy, currency, privacy, and relevance of proprietary enterprise LLMs. Time to insight and time to action in AI applications are faster and better with Pure Storage.
OVX Validated Reference Architecture for AI-ready Infrastructures
First question: What is OVX validation? OVX is NVIDIA’s standard validation paradigm for computing systems that combine high-performance GPU acceleration, graphics, and AI with fast, low-latency networking that are used to design and power complex 3D virtual worlds and digital twins that are transforming how businesses design, simulate, and optimize complex systems and processes. In this fantastic emerging realm of breathtaking technological achievements and innovations, Pure Storage has achieved OVX validation of their reference architecture for AI-ready infrastructures. At this stage, OVX validation applies directly to the increasing business demand for GenAI workloads (including RAG, LLMs, knowledge bases, and Vector DB), full-stack ready-to-run enterprise AI infrastructure, and local proprietary custom data + AI compute, storage, and networking solutions. Note: When you see “full-stack,” read “Pure Storage + NVIDIA working together seamlessly.”
Second question: What about technical debt and the cost of “lift and shift” to these new AI-ready architectures? For Pure Storage, OVX validation also certifies that Pure Storage’s AI-ready infrastructure will run on NVIDIA GPUs and on other vendors’ servers, which is a great savings on technical debt for those organizations that operate diverse server farms. OVX validation complements Pure Storage’s certified reference architecture for NVIDIA DGX BasePOD that was announced last year as well as their FlashStack® for AI Cisco Validated Designs announced here.
Since one of the only certainties about the future is its uncertainty, it is a great benefit that Pure Storage Evergreen//One™ provides storage-as-a-service (STaaS) guarantees and enables future-proof growth with non-disruptive upgrades. That means that Pure Storage owns the hardware (“the end user doesn’t pay for it”), but the end user buys a subscription to the storage with the same agility and flexibility of public cloud storage, and with all the security, proprietary protection, and performance of on-prem all-flash sustainable infrastructure. This is Pure Storage’s SLA-guaranteed cloud-like STaaS!
More Pure Storage Announcements at GTC 2024
Pure Storage’s RAG development (described earlier) is accelerating successful AI adoption across vertical industries. Pure Storage is accomplishing this by creating vertical-specific RAGs in collaboration with NVIDIA. First, “Pure Storage has created a financial services RAG solution to summarize and query massive data sets with higher accuracy than off-the-shelf LLMs. Financial services institutions can now gain faster insight using AI to create instant summaries and analysis from various financial documents and other sources.” Pure Storage will soon release additional RAGs for healthcare and the public sector.
Expanded investment in the AI partner ecosystem: Pure Storage is further investing in its AI partner ecosystem with NVIDIA, engaging in new partnerships with independent software vendors (ISVs). Some of these investments are aimed at optimizing GPU utilization through advanced orchestration and scheduling, and others enable machine learning teams to build, evaluate, and govern their model development lifecycle. Additionally, Pure Storage is working closely with numerous AI-focused resellers and service partners to further operationalize joint customer AI deployments.
Looking at AI Now and at What’s Next
As the award-winning leader in AI-ready (and future-ready) data infrastructure, Pure Storage is collaborating with NVIDIA to empower their global customers with a proven framework to manage the high-performance data and compute requirements that these enterprises need to drive successful AI deployments, both now and into the future. Every technical leader, line of business (LOB) leader, VP of Infrastructure for AI, VP of AI/Data Science, and CDO/CTO/CAIO can benefit right now from these technologies and services.
To put all of Pure Storage’s recent accomplishments, products, services, and solutions into a single statement, I would say that Pure Storage’s primary purpose (their North Star) is to guide and accelerate their customers’ adoption of AI through the Pure Storage platform for AI.
To learn more about all of this, make connections, learn new skills, and get ready for what’s next in this rapidly evolving season of AI, be sure to register and attend the Pure//Accelerate® 2024 live event June 18-21, 2024, at Resorts World Las Vegas. The event will have a special track on “Today’s and Tomorrow’s Applications of AI.” Don’t miss it!
Register Now for Pure//Accelerate 2024
Drive your data success at Pure//Accelerate® at Resorts World Las Vegas from June 18-21. This is the premier event to make connections, learn new skills, and get ready for what’s next. Here’s a sneak peek of what to expect:
Decades (at least) of business analytics writings have focused on the power, perspicacity, value, and validity in deploying predictive and prescriptive analytics for business forecasting and optimization, respectively. These are primarily forward-looking actionable (proactive) applications.
There are other dimensions of analytics that tend to focus on hindsight for business reporting and causal analysis – these are descriptive and diagnostic analytics, respectively, which are primarily reactive applications, mostly explanatory and investigatory, not necessarily actionable.
In the world of data there are other types of nuanced applications of business analytics that are also actionable – perhaps these are not too different from predictive and prescriptive, but their significance, value, and implementation can be explained and justified differently. Before we dive into these additional types of analytics applications, let us first consider a little pedagogical exercise with two simple evidence-based inferences.
(a) In essentially 100% of cases where an automobile is involved in an accident, the automobile had four wheels on the car prior to the accident.
(b) In 100% of divorce cases, the divorcing couple was married prior to the divorce.
What is the point of those obvious statistical inferences? The point is that the 100% association between the event and the preceding condition has no special predictive or prescriptive power. Hence, prior knowledge of these 100% associations does not offer any actionable value. In statistical terms, the joint probability of event Y and condition X co-occurring, designated P(X,Y), is essentially the probability P(Y) of event Y occurring. The probability of the condition X occurring, P(X), is irrelevant since the existence of the precondition X is implicitly present by default.
Okay, those examples represent two remarkably uninteresting cases. Even when similar sorts of inferences occur in a business context, they have essentially zero value. How do predictive and prescriptive analytics fit into this statistical framework?
Using the same statistical terminology, the conditional probability P(Y|X) (the probability of Y occurring, given the presence of precondition X) is an expression of predictive analytics. By exploring and analyzing the business data, analysts and data scientists can search for and uncover such predictive relationships. This is predictive power discovery. Another way of saying this is: given observed data X, we can predict some outcome Y. Or more simply: given X, find Y.
Similarly (actually, conversely), we can use the conditional probability P(X|Y) (which is the probability that the precondition X exists, given the existence of outcome Y) as an expression of prescriptive analytics. How does that work in practice? By exploring and analyzing business data, analysts and data scientists can search for and uncover the conditions (causal factors) that have led to different outcomes. So, if the business wants to optimize some outcome Y, then data analysts will be tasked with finding the conditions X that must be implemented to achieve that desired outcome. This is prescriptive power discovery. Another way of saying this is: given some desired optimal outcome Y, what conditions X should we put in place. Or more simply: given Y, find X. Note how this simple mathematical expression of prescriptive analytics is exactly the opposite of our previous expression of predictive analytics (given X, find Y).
Here are a few business examples of this type of prescriptive analytics: Which marketing campaign is most efficient and effective (has best ROI) in optimizing sales? Which environmental factors during manufacturing, packaging, or shipping lead to reduced product returns? Which pricing strategies lead to the best business revenue? What equipment maintenance schedule minimizes failures, downtime (mean time to recovery), and overall maintenance costs?
Now that we have described predictive and prescriptive analytics in detail, what is there left? What are the three types of actionable (and valuable) business analytics applications that are not called predictive or prescriptive? They are sentinel, precursor, and cognitive analytics. Let’s define what these are.
Sentinel Analytics – in common usage, the sentinel is the person on the guard station who is charged with watching for significant incoming or emergent activity. In practice, all activity is being observed and a decision is made as to whether any particular activity requires some sort of triage: sounding an alarm, or sending an alert to decision-makers, or doing nothing.
In the enterprise, sentinel analytics is most timely and beneficial when applied to real-time, dynamic data streams and time-critical decisions. For example, sensors (including internet of things devices and APIs on data networks) can be deployed with logic (analytics, statistical, and/or machine learning algorithms) to monitor and “watch” business systems and processes for emerging patterns, trends, behaviors, unusual operating modes, and anomalies that might be indicators of activities that require business attention, decisions, and/or action.
Precursor Analytics – in common usage, precursors are the early-warning indicators (harbingers, forerunners) of something else more serious or catastrophic that is about to come. We occasionally hear about earthquake precursors (increased levels of radon in groundwater), tidal wave precursors (a deep ocean earthquake), and cyber-attack precursors (phishing incidents). Precursor analytics is related to sentinel analytics. The latter (sentinel) is associated primarily with “watching” the data for interesting patterns that might require action, while precursor analytics is associated primarily with training the business systems to quickly identify those specific “learned” patterns and events that are known to be associated with high-risk events, thus requiring timely attention, intervention, and remediation.
In these applications, the data science involvement includes both the “learning” of the most significant patterns to alert on and the improvement of their models (logic) to minimize false positives and false negatives. The analytics triage is critical, to avoid alarm fatigue (sending too many unimportant alerts) and to avoid underreporting of important actionable events. One could say that sentinel analytics is more like unsupervised machine learning, while precursor analytics is more like supervised machine learning. That is not a totally clean separation and distinction, but it might help to clarify their different applications of data science.
The counterexample to the supervised learning explanation of precursor analytics is a “black swan” event – a rare high-impact event that is difficult to predict under normal circumstances – such as the global pandemic, which led to the failure of many predictive models in business. Broken models are definitely disruptive to analytics applications and business operations. Paradoxically, the precursor was actually predictive in a disruptive anti-predictive sort of way, which brings us right back to P(Y|X), or maybe it should be stated as P(“not Y”|X) where X is the black swan event (i.e., the predicted outcome Y from existing models will not occur in this case). As such, the global pandemic serves as a warning (a harbinger of disruption) and consequently as a “training example” to businesses for any future black swans.
Cognitive Analytics – this analytics mindset approach focuses on “surprise” discovery in data, using machine learning and AI to emulate and automate the cognitive abilities of humans. The goal is to discover novel, interesting, unexpected, and potentially valuable signals in the flood of streaming enterprise data. These may not be high-risk discoveries, but they could be high-reward discoveries. How does that resemble human cognitive abilities? Curiosity! Being curious about seeing something “funny” that you didn’t expect, thereby putting a “marker” in the data stream: “Look here! Pay attention! Ask questions about this!”
Cognitive analytics is basically the opposite of descriptive analytics. In descriptive analytics, the task is to find answers to predetermined business questions (how much, how many, how often, who, where, when), whereas cognitive analytics is tasked with finding the business questions that should be asked. Descriptive: find the right answers in the data. Cognitive: find the right questions in the data. Cognitive analytics can then be viewed as a precursor to diagnostic analytics, which is the investigative stage of analytics that answers the questions raised by cognitive analytics (“Why did this happen?”, “Why are we seeing this pattern in our data?”, “What is the business impact of this trend, anomaly, behavior?”, “What is our next-best action as a result of this?”, “That’s funny! What is that?”).
None of these descriptions of the 3 “new” analytics applications are meant to declare that these are completely distinct and different from the “big 4” analytics applications that we have known for many years (Descriptive, Diagnostic, Predictive, Prescriptive). But the differences between the “big 4” and the “new 3” are in the nuanced business applications of these analytics in the enterprise and in the types of inferences that the data scientists are asked to derive from the business data.
Deploying these analytics in the cloud further expands their accessibility, democratization, enterprise-wide acceptance, broad advocacy, and ultimate business value. Blending automated analytics products (coming from the sentinel, precursor, and cognitive applications) with human-in-the-loop inquisitiveness, curiosity, creativity, out-of-the-box thinking, idea generation, and persistence can transform any organization into a data analytics powerhouse through an analytic culture revolution. This is more imperative than ever, as a global survey of analytics executives has revealed:
“Companies have been working to become more data-driven for many years, with mixed results.”
“Right now, the biggest challenge for organizations working on their data strategy might not have to do with technology at all.”
“Corporate chief data, information, and analytics executives reported that cultural change is the most critical business imperative.”
“Just 26.5% of organizations report having established a data-driven organization.”
“91.9% of executives cite cultural obstacles as the greatest barrier to becoming data driven.”
Where do organizations get help to overcome these challenges? Microsoft delivers what its clients need to help them grow their top line with cloud-based analytics. Microsoft’s cloud-based analytics products and services propel business insights, innovation, and value from enterprise data, with all of the dimensions of analytics applications brought into the game. Specifically, cloud analytics (accessing and inferencing on multiple diverse business datasets across business units) for a wide variety of enterprise applications can sharpen the workforce’s focus on value and growth, including: forward-looking insights through predictive, sentinel, and precursor analytics; novel recommendations; rich customer engagement; analytic product innovation; resilience through prescriptive analytics; surprise discovery in data, asking the right questions, and exploring the most insightful lines of inquiry through cognitive analytics; and more.
Microsoft Azure Cloud extends ease-of-access analytics to all, delivers increased speed to deployment, provides leading security, compliance, and governance – with price performance for any organization. Whether organizations are seeking scalability in their enterprise data systems, advanced analytics capabilities (including the “big 4” and the “new 3”), real-time analytics (essential value-drivers from streaming data, including IoT, network logs, online customer interactions, supply chain, etc.), and the best in machine learning model-building and deployment services, Microsoft Azure Cloud has you covered. To learn more about it, go to https://azure.microsoft.com/en-us/solutions/cloud-scale-analytics and bring actionable business analytics to higher levels of proficiency and productivity across your organization.
I recently attended the Splunk .conf23 conference in Las Vegas. Well, the conference was in Vegas, while I was far away in my home office watching the live conference keynote sessions online. Despite the thousands of miles (and kilometers) of separation, I could feel the excitement in the room as numerous announcements were made, individuals were honored, customer success stories were presented, and new solutions and product features were revealed. I will summarize many of those here (specifically my major learning moments), though this report cannot provide a complete review of all that was said at .conf23, primarily because I attended only the two main keynote sessions, but also because the phenomenal number of remarkable things to hear and learn in those sessions exceeded my capacity to record them all in one succinct report.
When I reviewed highlights from last year’s Splunk .conf22 conference in my summary report at that time, I focused a lot on the Splunk Observability Cloud and its incredible suite of Observability and Monitoring products and services. This reflected my strong interest in observability at that time. My strong interest hasn’t diminished, and neither has Splunk’s developments and product releases in that space, as seen in observability’s prominent mention within many of Splunk’s announcements at this year’s .conf23 event. For a detailed report on the current state of observability this year, you can access and download “The State of Observability 2023” report from Splunk. Here are four specific metrics from the report, highlighting the potentially huge enterprise system benefits coming from implementing Splunk’s observability and monitoring products and services:
Four times as many leaders who implement observability strategies resolve unplanned downtime in just minutes, not hours or days.
Leaders report one-third the number of outages per year, on average, compared to those organizations who do not implement observability and monitoring.
Leaders are 7.9x as likely to say that their ROI on observability tools far exceeded expectations.
89% of leaders are completely confident in their ability to meet their application availability and performance requirements, versus just 43% of others.
Here are my top learnings from .conf23:
Splunk announced a new strategic partnership with Microsoft Azure, thereby adding another major cloud provider to their other cloud provider partnerships, bringing Splunk products and services into more enterprises through the Azure Marketplace. This partnership also specifically extends hybrid cloud capabilities that will enhance organizations’ digital resilience, while enabling transformation, modernization, migration, and growth in all enterprise digital systems with confidence, trust, and security.
Digital resilience was a major common theme across all of the Splunk announcements this week. As I heard someone say in the keynote session, “You had me at resilience!” By providing real-time data insights into all aspects of business and IT operations, Splunk’s comprehensive visibility and observability offerings enhance digital resilience across the full enterprise. Organizations are able to monitor integrity, quality drift, performance trends, real-time demand, SLA (service level agreement) compliance metrics, and anomalous behaviors (in devices, applications, and networks) to provide timely alerting, early warnings, and other confidence measures. From these data streams, real-time actionable insights can feed decision-making and risk mitigations at the moment of need. Such prescriptive capabilities can be more proactive, automated, and optimized, making digital resilience an objective fact for businesses, not just a business objective. I call that “digital resilience for the win!”
Several Splunk customer success stories were presented, with interesting details of their enterprise systems, the “back stories” that led them to Splunk, the transformations that have occurred since Splunk integration, and the metrics to back up the success stories. Customers presenting at .conf23 included FedEx, Carnival Corporation & plc, Inter IKEA, and VMware. Here are a few of the customer performance metrics presented (measuring performance changes following the Splunk integration into the customers’ enterprise systems): 3X Faster Response Time, 90% Faster Mean Time to Remediation, and 60X Faster Insights.
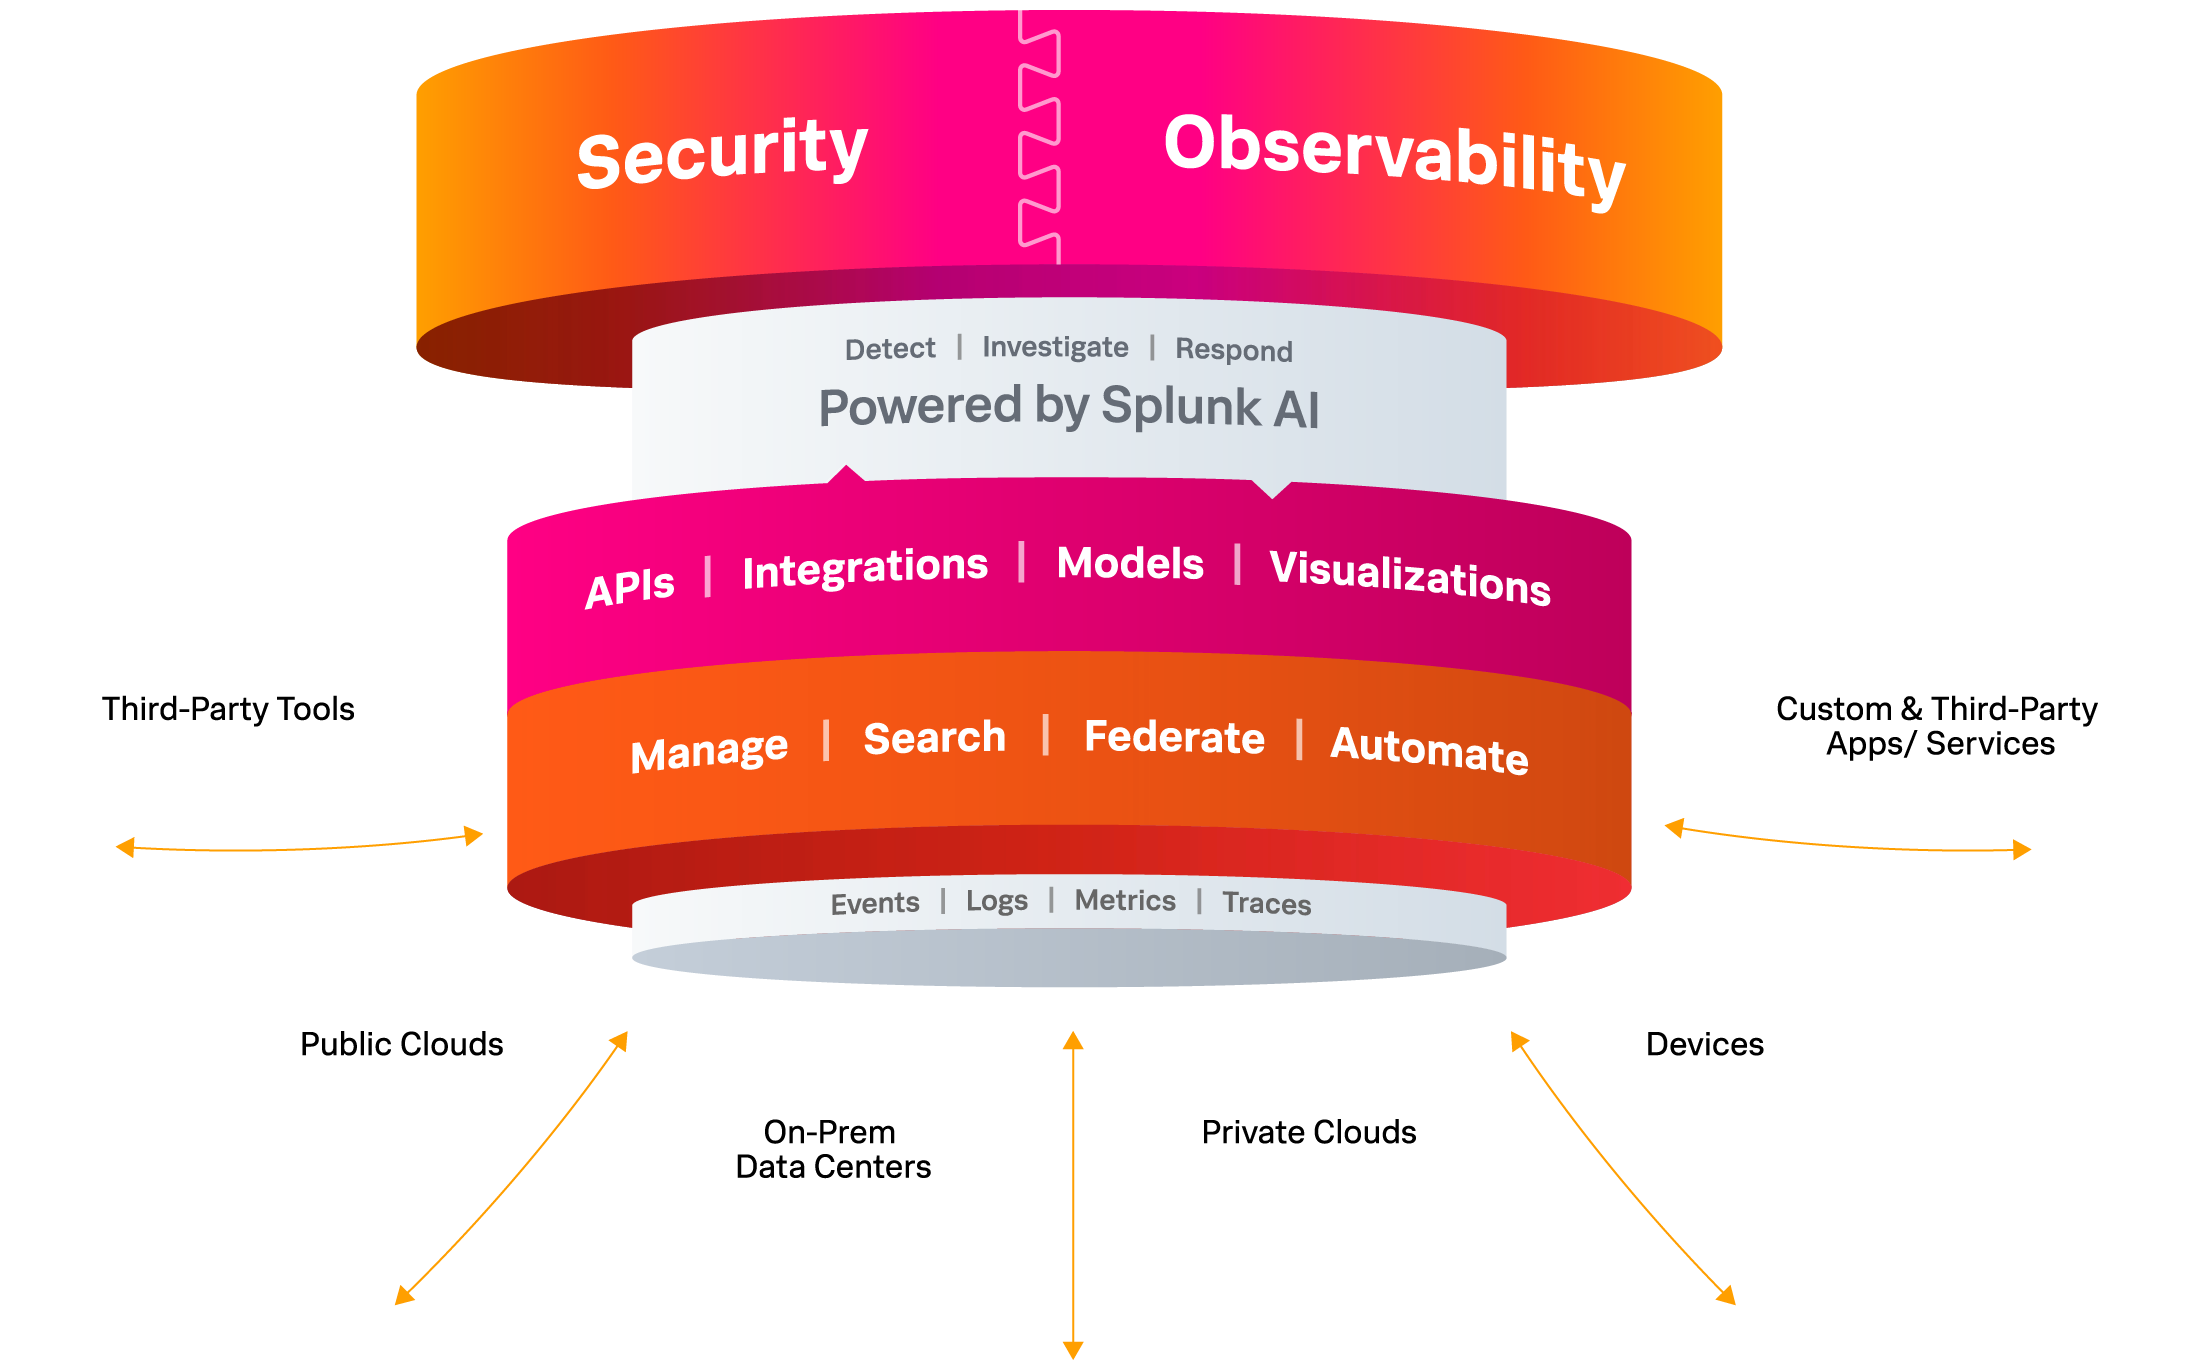
Splunk has brought greater integration and customer ease-of-use of their offerings through a Unified Security and Observability Platform. This unified operations center (Splunk Mission Control) amplifies the efficiency (time to problem resolution) and effectiveness (number of time-critical problems resolved) of ITOps and DevOps teams, requiring fewer manual steps in correlating data streams from multiple systems in order to determine the root cause of an incident. Further enhancing the user experience, the unified platform provides end-to-end enterprise systems visibility and federated search across those systems.
Splunk Mission Control (just mentioned above) – Splunk describes it best: “Splunk Mission Control brings together Splunk’s industry-leading security technologies that help customers take control of their detection, investigation and response processes. Splunk’s security offerings include security analytics (Splunk Enterprise Security), automation and orchestration (Splunk SOAR), and threat intelligence capabilities. In addition, Splunk Mission Control offers simplified security workflows with processes codified into response templates. With Splunk Mission Control, security teams can focus on mission-critical objectives, and adopt more proactive, nimble security operations.”
Model-Assisted Threat Hunts, also known as Splunk M-ATH, is Splunk’s brand name for machine learning-assisted threat hunting and mitigation. M-ATH is part of the PEAK (Prepare, Execute, and Act with Knowledge) Framework, that consists of three types of hunts: (1) Hypothesis-driven (i.e., testing for hypothesized threats, behaviors, and activities), (2) Baseline (i.e., search for deviations from normal behaviors through EDA: Exploratory Data Analysis), and (3) M-ATH (i.e., automation of the first two type of hunts, using AI and machine learning). M-ATH includes ML-assisted adaptive thresholding and outlier handling, for improved alerts (i.e., faster alerting with fewer false positives and false negatives).
“Don’t be a SOAR loser!” Okay, that’s what one of the Splunk speakers said at .conf23. By that, he was referring to being a winner with Splunk SOAR: Security Orchestration, Automation and Response. SOAR orchestrates, prioritizes, and automates security teams (SecOps) workflows and tasks, enabling more accurate, more complete, smarter, and faster response to security incidents. As Splunk says, “Automate so you can innovate.” Isn’t that always a business truth? If you can free your analyst teams to think outside the box, hypothesize, innovate, and test new methods and solutions, then that is the sure path to being a SAFE (Security Analytics For the Enterprise) winner: soar with SOAR! While SIEM (Security Information and Event Management) aims to manage the data flows, logging, audits, alerted events, and incident responses, SOAR automates these security activities (using machine learning and AI), monitors the data and events for anomalous behaviors, classifies (prioritizes) the events, and then orchestrates optimized security operations and incident responses (using playbooks).
Saving my best two .conf23 learning moments for last, first up is Splunk Edge Hub. This is a physical device, in the IoT (Internet of Things) family of sensors, that collects and streams data from the edge (i.e., from edge devices, cameras, streaming data sources, monitoring systems, and sensors of all types) into Splunk systems that go to work on those data: security operations, anomaly detection, event classification, trend detection, drift detection, behavior detection, and any other edge application that requires monitoring and observability, with an injection of machine learning and AI for intelligent data understanding, classification, prioritization, optimization, and automation. Since business thrives at the edge (through insights discovery and actionable analytics at the point—time and place—of data collection), an edge hub is just what a business needs to mitigate risk, ensure visibility, escalate incidents for review, optimize the operational response, and monitor the associated activities (causes and effects).
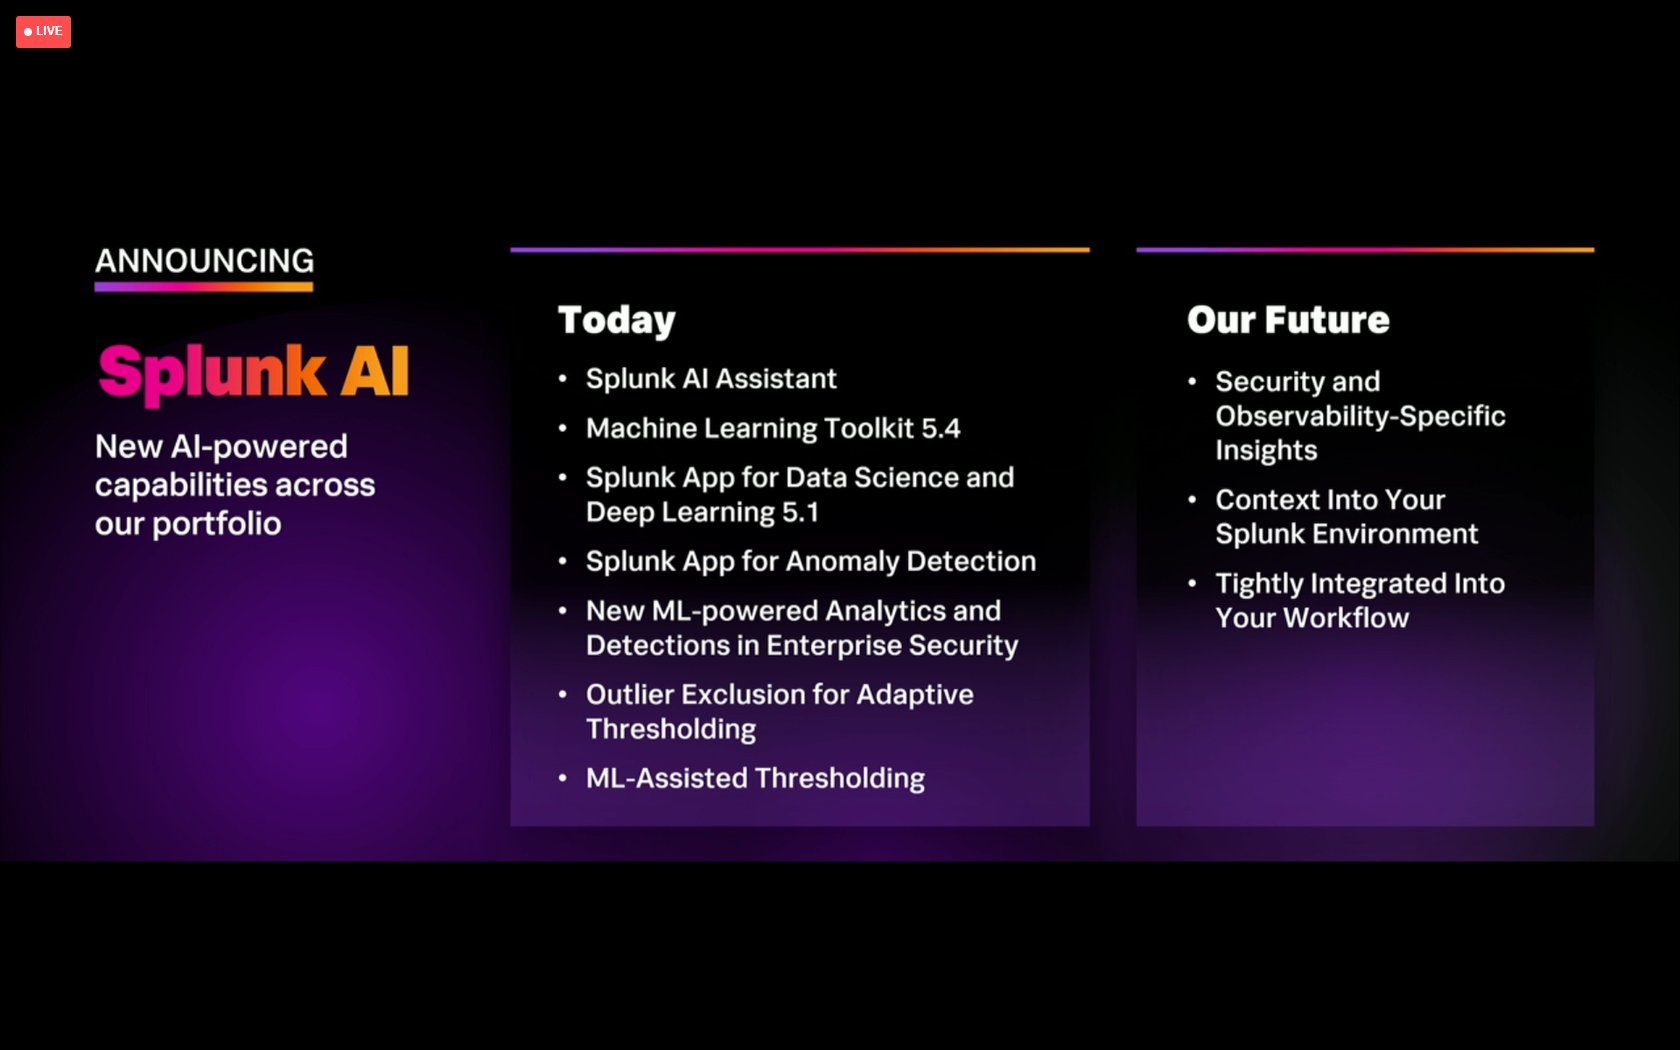
Splunk AI Assistant– Boom! This is the brilliant and innovative introduction of an AI assistant into Splunk products, services, and user workflows. This includes the latest and best of AI — generative AI and natural language interfaces integrated within the Splunk platform. This product release most definitely enables and “catalyzes digital resilience in cybersecurity and observability.” This is not just a product release. It is a “way of life” and “a way of doing business” with Splunk products and services. AI is not just a tacked-on feature, but it is a fundamental characteristic and property of those products’ features. Splunk AI increases productivity, efficiency, effectiveness, accuracy, completeness, reliability, and (yes!) resilience across all enterprise SecOps, ITOps, and AIOps functions, tasks, and workflows that are powered by Splunk. Generative AI enables the Splunk SecOps and ITOps tasks, workflows, processes, insights, alerts, and recommended actions to be domain-specific and customer-specific. It automatically detects anomalies and focuses attention where it’s needed most, for that business in that domain, while providing full control and transparency on which data and how data are used to train the AI, and how much control is assigned to the AI (by maintaining “human in the loop” functionality). With regard to the natural language features, Splunk AI Assistant leverages generative AI to provide an interactive chat experience and helps users create SPL (Splunk Processing Language) queries using natural language. This feature not only improves time-to-value, but it “helps make SPL more accessible, further democratizing an organization’s access to, and insights from, its data” – and that includes automated recommendations to the user for “next best action”, which is a great learning prompt for new Splunk users and SecOps beginners.
For a peek into my peak real-time experiences at .conf23, see my #splunkconf23 social thread on Twitter at https://bit.ly/3DjI5NU. Actually, go there and explore, because there is so much more to see there than I could cover in this one report.
Closing thoughts – AI (particularly generative AI) has been the hottest tech topic of the year, and Splunk .conf23 did not disappoint in their coverage of this topic. The agendas for some events are filled with generic descriptions that sing the praises of generative AI. This Splunk event .conf23 provided something far more beneficial and practical: they presented demonstrably valuable business applications of generative AI embedded in Splunk products, which deliver a convincing Splunk-specific productivity enhancer for new and existing users of Splunk products. When the tech hype train is moving as fast as it has been this year, it is hard for a business to quickly innovate, incorporate, and deliver substantially new features that use the new tech within their legacy products and services, but Splunk has done so, with top marks for those achievements.
Disclaimer: I was compensated as an independent freelance media influencer for my participation at the conference and for this article. The opinions expressed here are entirely my own and do not represent those of Splunk or of any Splunk partners. Any misrepresentations of the products and services mentioned in my statements are entirely my own responsibility. Nothing here should be construed as an offer to sell or as financial advice of any kind. My comments are entirely of a technical nature, focused on the technical capabilities of the items mentioned in the article.
I recently saw an informal online survey that asked users which types of data (tabular, text, images, or “other”) are being used in their organization’s analytics applications. This was not a scientific or statistically robust survey, so the results are not necessarily reliable, but they are interesting and provocative. The results showed that (among those surveyed) approximately 90% of enterprise analytics applications are being built on tabular data. The ease with which such structured data can be stored, understood, indexed, searched, accessed, and incorporated into business models could explain this high percentage. A similarly high percentage of tabular data usage among data scientists was mentioned here.
If my explanation above is the correct interpretation of the high percentage, and if the statement refers to successfully deployed applications (i.e., analytics products, in contrast to non-deployed training experiments, demos, and internal validations of the applications), then maybe we would not be surprised if a new survey (not yet conducted) was to reveal that a similar percentage of value-producing enterprise data innovation and analytics/ML/AI applications (hereafter, “analytics products”) are based on on-premises (on-prem) data sources. Why? … because the same productivity benefits mentioned above for tabular data sources (fast and easy data access) would also be applicable in these cases (on-prem data sources). And no one could deny that these benefits would be substantial. What could be faster and easier than on-prem enterprise data sources?
Accompanying the massive growth in sensor data (from ubiquitous IoT devices, including location-based and time-based streaming data), there have emerged some special analytics products that are growing in significance, especially in the context of innovation and insights discovery from on-prem enterprise data sources. These enterprise analytics products are related to traditional predictive and prescriptive analytics, but these emergent products may specifically require low-latency (on-prem) data delivery to support enterprise requirements for timely, low-latency analytics product delivery. These three emergent analytics products are:
(a) Sentinel Analytics – focused on monitoring (“keeping an eye on”) multiple enterprise systems and business processes, as part of an observability strategy for time-critical business insights discovery and value creation from enterprise data sources. For example, sensors can monitor and “watch” systems and processes for emergent trends, patterns, anomalies, behaviors, and early warning signs that require interventions. Monitoring of data sources can include online web usage actions, streaming IT system patterns, system-generated log files, customer behaviors, environmental (ESG) factors, energy usage, supply chain, logistics, social and news trends, and social media sentiment. Observability represents the business strategy behind the monitoring activities. The strategy addresses the “what, when, where, why, and how” questions from business leaders concerning the placement of “sensors” that are used to collect the essential data that power the sentinel analytics product, in order to generate timely insights and thereby enable better data-informed “just in time” business decisions.
(b) Precursor Analytics – the use of AI and machine learning to identify, evaluate, and generate critical early-warning alerts in enterprise systems and business processes, using high-variety data sources to minimize false alarms (i.e., using high-dimensional data feature space to disambiguate events that seem to be similar, but are not). Precursor analytics is related to sentinel analytics. The latter is associated primarily with “watching” the data for interesting patterns, while precursor analytics is associated primarily with training the business systems to quickly identify those specific patterns and events that could be associated with high-risk events, thus requiring timely attention, intervention, and remediation. One could say that sentinel analytics is more like unsupervised machine learning, while precursor analytics is more like supervised machine learning. That is not a totally clear separation and distinction, but it might help to clarify their different applications of data science. Data scientists work with business users to define and learn the rules by which precursor analytics models produce high-accuracy early warnings. For example, an exploration of historical data may reveal that an increase in customer satisfaction (or dissatisfaction) with one particular product is correlated with some other satisfaction (or dissatisfaction) metric downstream at a later date. Consequently, based on this learning, deploying a precursor analytics product to detect the initial trigger event early can thus enable a timely response to the situation, which can produce a positive business outcome and prevent an otherwise certain negative outcome.
(c) Cognitive Analytics – focused on “surprise” discovery in diverse data streams across numerous enterprise systems and business processes, using machine learning and data science to emulate and automate the curiosity and cognitive abilities of humans – enabling the discovery of novel, interesting, unexpected, and potentially business-relevant signals across all enterprise data streams. These may not be high risk. They might actually be high-reward discoveries. For example, in one company, an employee noticed that it was the customer’s birthday during their interaction and offered a small gift to the customer at that moment—a gift that was pre-authorized by upper management because they understood that their employees are customer-facing and they anticipated that their employees would need to have the authority to take such customer-pleasing actions “in the moment”. The outcome was very positive indeed, as this customer reported the delightful experience on their social media account, thereby spreading positive sentiment about the business to a wide audience. Instead of relying on employees to catch all surprises in the data streams, the enterprise analytics applications can be trained to automatically watch for, identify, and act on these surprises. In the customer birthday example, the cognitive analytics product can be set up for automated detection and response, which can occur without the employee in the loop at all, such as in a customer’s online shopping experience or in a chat with the customer call center bot.
These three analytics products are derived from business value-driven data innovation and insights discovery in the enterprise. Investigating and deploying these are a worthy strategic move for any organization that is swimming in a sea (or lake or ocean) of on-prem enterprise data sources.
In closing, let us look at some non-enterprise examples of these three types of analytics:
Sentinel – the sentinel on the guard station at a military post is charged with watching for incoming activity. They are assigned this duty just in case something occurs during the night or when everyone else is busy with other operational things. That “something” might be an enemy approaching or a wild bear in the forest. In either case, keeping an eye on the situation is critical for the success of the operation. Another example of a sentinel is a marked increase in the volatility of stock market prices, indicating that there may be a lot of FUD (fear, uncertainty, and doubt) in the market that could lead to wild swings or downturns. In fact, anytime that any streaming data monitoring metric shows higher than usual volatility, this may be an indicator that the monitored thing requires some attention, an investigation, and possibly an intervention.
Precursor – prior to large earthquakes, it has been found that increased levels of radon are detected in soil, in groundwater, and even in the air in people’s home basements. This precursor is presumed to be caused by the radon being released from cavities within the Earth’s crust as the crust is being strained prior to the sudden slippage (the earthquake). Earthquakes themselves can be precursors to serious events – specifically, a large earthquake detected at the bottom of the ocean can produce a massive tidal wave, that can travel across the ocean and have drastic consequences on distant shores. In some cases, the precursor can occur sufficiently in advance of the tidal wave’s predicted arrival at inhabited shores, thereby enabling early warnings to be broadcasted. In both of these cases, the precursor (radon release or ocean-based earthquake) is not the biggest problem, though they may be seen as sentinels of an on-going event, but the precursor is an early warning sign of a potentially bigger catastrophe that’s coming (a major land-based earthquake or a tidal wave hitting major population centers along coastlines, respectively).
Cognitive – a cognitive person walking into an intense group meeting (perhaps a family or board meeting) can probably tell the mood of the room fairly quickly. The signals are there, though mostly contextual, thus probably missed by a cognitively impaired person. A cognitive person is curious about odd things that they see and hear—things or circumstances or behaviors that seem out of context, unusual, and surprising. The thing itself (or the data about the thing) may not be surprising (though it could be), but the context (the “metadata”, which is “other data about the primary data”) provides a signal that something needs attention here. Perhaps the simplest expression of being cognitive in this data-drenched world comes from a quote attributed to famous science writer Isaac Asimov: “The most exciting phrase to hear in science, the one that heralds new discoveries, is not ‘Eureka!’ (I found it!) but ‘That’s funny…‘.”
The cognitive enterprise versus the cognitively impaired enterprise – which of these would your organization prefer to be? Get moving now with sentinel, precursor, and cognitive analytics through data innovation and insights discovery with your on-prem enterprise data sources.
Read more about analytics innovation from on-prem enterprise data sources in this 3-part blog series:
Artificial intelligence (AI) is top of mind for executives, business leaders, investors, and most workplace employees everywhere. The impacts are expected to be large, deep, and wide across the enterprise, to have both short-term and long-term effects, to have significant potential to be a force both for good and for bad, and to be a continuing concern for all conscientious workers. In confronting these winds of change, enterprise leaders are faced with many new questions, decisions, and requirements – including the big question: are these winds of change helping us to move our organization forward (tailwinds) or are they sources of friction in our organization (headwinds)?
The current AI atmosphere in enterprises reminds us of the internet’s first big entrance into enterprises nearly three decades ago. I’m not referring to the early days of email and Usenet newsgroups, but the tidal wave of Web and e-Commerce applications that burst onto the business scene in the mid-to-late 1990’s. While those technologies brought much value to the enterprise, they also brought an avalanche of IT security concerns into the C-suite, leading to more authoritative roles for the CIO and the CISO. The fraction of enterprise budgets assigned to these IT functions (especially cybersecurity) suddenly and dramatically increased. That had and continues to have a very big and long-lasting impact.
The Web/e-Commerce tidal wave also brought a lot of hype and FOMO, which ultimately led to the Internet bubble burst (the dot-com crash) in the early 2000’s. AI, particularly the new wave of generative AI applications, has the potential to repeat this story, potentially unleashing a wave of similar patterns in the enterprise. Are we heading for another round of hype / high hopes / exhilaration / FOMO / crash and burn with AI? I hope not.
I would like to believe that a sound, rational, well justified, and strategic introduction of the new AI technologies (including ChatGPT and other generative AI applications) into enterprises can offer a better balance on the fast slopes of technological change (i.e., protecting enterprise leaders from getting out too far over their skis). In our earlier article, we discussed “AI Readiness is Not an Option.” In this article here, we offer some considerations for enterprise AI to add to those strategic conversations. Specifically, we look at considerations from the perspective of the fuel for enterprise AI applications: the algorithms, the data, and the enterprise AI infrastructure. Here is my list:
This year, artificial intelligence (AI) has become a major conversation centerpiece at home, in the park, at the gym, at work, everywhere. This is not entirely due to or related to ChatGPT and LLMs (large language models), though those have been the main drivers. The AI conversations, especially in technical circles, have focused intensively on generative AI, the creation of written content, images, videos, marketing copy, software code, speeches, and countless other things. For a short introduction to generative AI, see my article “Generative AI – Chapter 1, Page 1”.
While there has been huge public interest in generative AI (specifically, ChatGPT) by individuals, there has been a transformative impact on organizations everywhere, both in strategy conversations and tactical deployments. Businesses and others are seeking to leverage generative AI to increase productivity (efficiencies and effectiveness) in nearly all aspects of their enterprise.
To support essential enterprise AI strategy conversations, here are 12 key points for organizations to consider within the context of “AI readiness is not an option, but an imperative”:
Anyone who has been watching the AI space this year, even peripherally, will have noticed the flaming hot story of the year—ChatGPT and related chatbot applications. These AI applications are essentially deep machine learning models that are trained on hundreds of gigabytes of text and that can provide detailed, grammatically correct, and “mostly accurate” text responses to user inputs (questions, requests, or queries, which are called prompts). Specifically, these are LLMs—large language models. It is imperative, not an option, for organizations (and for most individuals) to be aware of what is going on here—not only because it is all over the news, but because it could affect your future self.
When I said “mostly accurate,” I meant that sometimes the ChatGPT responses go way off target—people refer to these as “hallucinations,” which is basically a reflection of the statistical basis of the models (see below)—the application will generate some plausible-sounding, grammatically correct statements that are complete falsehoods, such as “Leonardo da Vinci painted the Mona Lisa in 1815” (which is a real example of an observed ChatGPT hallucination).
I tested ChatGPT with my own account, and I was impressed with the results. I prompted it with various requests, including: Write a short story on a specific topic, provide a layperson’s explanations of some complex deep machine learning concepts, create a lesson plan to learn a tough subject, create an outline for a blog on a particular topic (no, not this one), and provide some financial advice on particular investments (no, it did not provide specific advice, but it did offer warnings like NFA “Not Financial Advice” and DYOR “Do Your Own Research”). You can find my results on my Medium blog site.
LLMs are so responsive and grammatically correct (even over many paragraphs of text) that some people worry that it is sentient. Guess what? It isn’t. It is merely a very large statistical model that provides the most likely sequence of words in response to a prompt. It is effectively a galaxy-sized statistically rich version of text autocomplete on your smartphone’s text messaging app, which already delivers some highly probable guesses for the missing words in a text message like this one: “Due to a client deadline, I will be working late at the ____ this ____, so I will be home late for ____.” LLMs can respond to much more complex (but well-posed) prompts, such as lesson plans for education, content for a business presentation, code for a software task, workflow steps for an IT project, and much more.
In order to help people to create well-posed prompts, the new discipline of prompt engineering has arisen. It’s not hard to find many online guides to prompt engineering, including guides for very specific industries, business tasks, workplace applications, and context-dependent scenarios. You don’t need prompt engineering to find those guides—a simple web search should do the trick. And guess what? When web search engines were first created, it took a while for us to learn how to submit well-posed keyword searches. That scenario is being played out again with ChatGPT and prompt engineering, but now our queries are aimed at a much more language-based, AI-powered, statistically rich application. If you understand Bayes’ Theorem and Bayesian statistics, then you will understand me when I say that we are talking here about an enormously more enriched set of priors, likelihoods, and evidence to feed the LLMs—so, it should not be surprising that the posteriors are shockingly good for large text outputs (most of the time).
LLMs are a subset of the deep learning field of natural language processing (NLP), which includes natural language understanding (NLU) and natural language generation (NLG). Think of chatbots and you get the idea, just expanded to a much, much larger domain of AI-based conversation.
Computer vision (CV) is another subset of deep learning, specifically aimed at object/pattern detection, recognition, and classification in images (including still images and video sequences). ChatGPT and LLMs are examples of generative AI using NLP for text generation. Stable Diffusion, Midjourney, and Dall-E are examples of generative AI using CV for image generation. Oh, by the way, I asked the generative AI at Stable Diffusion to create some images to go with my short story (which you can find on my Medium blog).
Beyond the individual examples of generative AI (and its components, ChatGPT, Stable Diffusion, etc.) that we can all experiment with, the applications in the enterprise can be tremendously impactful and transformative for organizations and the future of work. Those next chapters in the story are being written right now.
Continue reading about Enterprise AI in these posts:
Generative AI is the biggest and hottest trend in AI (Artificial Intelligence) at the start of 2023. While generative AI has been around for several years, the arrival of ChatGPT (a conversational AI tool for all business occasions, built and trained from large language models) has been like a brilliant torch brought into a dark room, illuminating many previously unseen opportunities.
Every business wants to get on board with ChatGPT, to implement it, operationalize it, and capitalize on it. It is important to realize that the usual “hype cycle” rules prevail in such cases as this. First, don’t do something just because everyone else is doing it – there needs to be a valid business reason for your organization to be doing it, at the very least because you will need to explain it objectively to your stakeholders (employees, investors, clients). Second, doing something new (especially something “big” and disruptive) must align with your business objectives – otherwise, you may be steering your business into deep uncharted waters that you haven’t the resources and talent to navigate. Third, any commitment to a disruptive technology (including data-intensive and AI implementations) must start with a business strategy.
I suggest that the simplest business strategy starts with answering three basic questions: What? So what? Now what? That is: (1) What is it you want to do and where does it fit within the context of your organization? (2) Why should your organization be doing it and why should your people commit to it? (3) How do we get started, when, who will be involved, and what are the targeted benefits, results, outcomes, and consequences (including risks)? In short, you must be willing and able to answer the six WWWWWH questions (Who? What? When? Where? Why? and How?).
Another strategy perspective on technology-induced business disruption (including generative AI and ChatGPT deployments) is to consider the three F’s that affect (and can potentially derail) such projects. Those F’s are: Fragility, Friction, and FUD (Fear, Uncertainty, Doubt).
Fragility occurs when a built system is easily “broken” when some component is changed. These changes may include requirements drift, data drift, model drift, or concept drift. The first one (requirements drift) is a challenge in any development project (when the desired outcomes are changed, sometimes without notifying the development team), but the latter three are more apropos to data-intensive product development activities (which certainly describes AI projects). A system should be sufficiently agile and modular such that changes can be made with as little impact to the overall system design and operations as possible, thus keeping the project off the pathway to failure. Since ChatGPT is built from large language models that are trained against massive data sets (mostly business documents, internal text repositories, and similar resources) within your organization, consequently attention must be given to the stability, accessibility, and reliability of those resources.
Friction occurs when there is resistance to change or to success somewhere in the project lifecycle or management chain. This can be overcome with small victories (MVP minimum viable products, or MLP minimum lovable products) and with instilling (i.e., encouraging and rewarding) a culture of experimentation across the organization. When people are encouraged to experiment, where small failures are acceptable (i.e., there can be objective assessments of failure, lessons learned, and subsequent improvements), then friction can be minimized, failure can be alleviated, and innovation can flourish. A business-disruptive ChatGPT implementation definitely fits into this category: focus first on the MVP or MLP.
FUD occurs when there is too much hype and “management speak” in the discussions. FUD can open a pathway to failure wherever there is: (a) Fear that the organization’s data-intensive, machine learning, AI, and ChatGPT activities are driven by FOMO (fear of missing out, sparked by concerns that your competitors are outpacing your business); (b) Uncertainty in what the AI / ChatGPT advocates are talking about (a “Data Literacy” or “AI Literacy” challenge); or (c) Doubt that there is real value in the disruptive technology activities (due to a lack of quick-win MVP or MLP examples).
I have developed a few rules to help drive quick wins and facilitate success in data-intensive and AI (e.g., Generative AI and ChatGPT) deployments. These rules are not necessarily “Rocket Science” (despite the name of this blog site), but they are common business sense for most business-disruptive technology implementations in enterprises. Most of these rules focus on the data, since data is ultimately the fuel, the input, the objective evidence, and the source of informative signals that are fed into all data science, analytics, machine learning, and AI models.
Here are my 10 rules (i.e., Business Strategies for Deploying Disruptive Data-Intensive, AI, and ChatGPT Implementations):
Honor business value above all other goals.
Begin with the end in mind: goal-oriented, mission-focused, and outcomes-driven, while being data-informed and technology-enabled.
Know thy data: understand what it is (formats, types, sampling, who, what, when, where, why), encourage the use of data across the enterprise, and enrich your datasets with searchable (semantic and content-based) metadata (labels, annotations, tags). The latter is essential for AI implementations.
Love thy data: data are never perfect, but all the data may produce value, though not immediately. Clean it, annotate it, catalog it, and bring it into the data family (connect the dots and see what happens). For example, outliers are often dismissed as random fluctuations in data, but they may be signaling at least one of these three different types of discovery: (a) data quality problems, associated with errors in the data measurement and capture processes; (b) data processing problems, associated with errors in the data pipeline and transformation processes; or (c) surprise discovery, associated with real previously unseen novel events, behaviors, or entities arising in your data stream.
Do not covet thy data’s correlations: a random six-sigma event is one-in-a-million. So, if you have 1 trillion data points (e.g., a Terabyte of data), then there may be one million such “random events” that will tempt any decision-maker into ascribing too much significance to this natural randomness.
Validation is a virtue, but generalization is vital: a model may work well once, but not on the next batch of data. We must monitor for overfitting (fitting the natural variance in the data), underfitting (bias), data drift, and model drift. Over-specifying and over-engineering a model for a data-intensive implementation will likely not be applicable to previously unseen data or for new circumstances in which the model will be deployed. A lack of generalization is a big source of fragility and dilutes the business value of the effort.
Honor thy data-intensive technology’s “easy buttons” that enable data-to-discovery (D2D), data-to-“informed decision” (D2ID), data-to-“next best action” (D2NBA), and data-to-value (D2V). These “easy buttons” are: Pattern Detection (D2D), Pattern Recognition (D2ID), Pattern Exploration (D2NBA), and Pattern Exploitation (D2V).
Remember to Keep it Simple and Smart (the “KISS” principle). Create a library of composable, reusable building blocks and atomic business logic components for integration within various generative AI implementations: microservices, APIs, cloud-based functions-as-a-service (FaaS), and flexible user interfaces. (Suggestion: take a look at MACH architecture.)
Keep it agile, with short design, develop, test, release, and feedback cycles: keep it lean, and build on incremental changes. Test early and often. Expect continuous improvement. Encourage and reward a Culture of Experimentation that learns from failure, such as “Test, or get fired!”
Finally, I offer a very similar (shorter and slightly different) set of Business Strategies for Deploying Disruptive Data-Intensive, AI, and ChatGPT Implementations, from the article “The breakthrough that is ChatGPT: How much does it cost to build?“. Here is the list from that article’s “C-Suite’s Guide to Developing a Successful AI Chatbot”:
In this post, we will examine ways that your organization can separate useful content into separate categories that amplify your own staff’s performance. Before we start, I have a few questions for you.
What
attributes of your organization’s strategies can you attribute to successful
outcomes? How long do you deliberate before taking specific deliberate actions?
Do you converse with your employees about decisions that might be the converse
of what they would expect? Is a process modification that saves a minute in
someone’s workday considered too minute for consideration? Do you present your
employees with a present for their innovative ideas? Do you perfect your plans
in anticipation of perfect outcomes? Or do you project foregone conclusions on
a project before it is completed?
If
you have good answers to these questions, that is awesome! I would not contest
any of your answers since this is not a contest. In fact, this is actually
something quite different. Before you combine all these questions in a heap and
thresh them in a combine, and before you buffet me with a buffet of skeptical
remarks, stick with me and let me explain. Do not close the door on me when I
am so close to giving you an explanation.
What
you have just experienced is a plethora of heteronyms. Heteronyms are words
that are spelled identically but have different meanings when pronounced
differently. If you include the title of this blog, you were just presented
with 13 examples of heteronyms in the preceding paragraphs. Can you find them
all?
Seriously
now, what do these word games have to do with content strategy? I would say
that they have a great deal to do with it. Specifically, in the modern era of
massive data collections and exploding content repositories, we can no longer
simply rely on keyword searches to be sufficient. In the case of a heteronym, a
keyword search would return both uses of the word, even though their meanings
are quite different. In “information retrieval” language, we would say that we
have high RECALL, but low PRECISION. In other words, we can find most occurrences
of the word (recall), but not all the results correspond to the meaning of our
search (precision). That is no longer good enough when the volume is so high.
The
key to success is to start enhancing and augmenting content management systems
(CMS) with additional features: semantic content and context. This is
accomplished through tags, annotations, and metadata (TAM). TAM management,
like content management, begins with business strategy.
Strategic content management focusses on business outcomes, business process improvement, efficiency (precision – i.e., “did I find only the content that I need without a lot of noise?”), and effectiveness (recall – i.e., “did I find all the content that I need?”). Just because people can request a needle in the haystack, it is not a good thing to deliver the whole haystack that contains that needle. Clearly, such a content delivery system is not good for business productivity. So, there must be a strategy regarding who, what, when, where, why, and how is the organization’s content to be indexed, stored, accessed, delivered, used, and documented. The content strategy should emulate a digital library strategy. Labeling, indexing, ease of discovery, and ease of access are essential if end-users are to find and benefit from the collection.
My favorite approach to TAM creation and to modern data management in general is AI and machine learning (ML). That is, use AI and machine learning techniques on digital content (databases, documents, images, videos, press releases, forms, web content, social network posts, etc.) to infer topics, trends, sentiment, context, content, named entity identification, numerical content extraction (including the units on those numbers), and negations. Do not forget the negations. A document that states “this form should not be used for XYZ” is exactly the opposite of a document that states “this form must be used for XYZ”. Similarly, a social media post that states “Yes. I believe that this product is good” is quite different from a post that states “Yeah, sure. I believe that this product is good. LOL.”
Contextual TAM enhances a CMS with knowledge-driven search and retrieval, not just keyword-driven. Contextual TAM includes semantic TAM, taxonomic indexing, and even usage-based tags (digital breadcrumbs of the users of specific pieces of content, including the key words and phrases that people used to describe the content in their own reports). Adding these to your organization’s content makes the CMS semantically searchable and usable. That’s far more laser-focused (high-precision) than keyword search.
One
type of implementation of a content strategy that is specific to data
collections are data catalogs. Data catalogs are very useful and important.
They become even more useful and valuable if they include granular search
capabilities. For example, the end-user may only need the piece of the dataset
that has the content that their task requires, versus being delivered the full
dataset. Tagging and annotating those subcomponents and subsets (i.e.,
granules) of the data collection for fast search, access, and retrieval is also
important for efficient orchestration and delivery of the data that fuels AI,
automation, and machine learning operations.
One
way to describe this is “smart content” for intelligent digital business
operations. Smart content includes labeled (tagged, annotated) metadata (TAM).
These labels include content, context, uses, sources, and characterizations
(patterns, features) associated with the whole content and with individual
content granules. Labels can be learned through machine learning, or applied by
human experts, or proposed by non-experts when those labels represent cognitive
human-discovered patterns and features in the data. Labels can be learned and
applied in existing CMS, in massive streaming data, and in sensor data
(collected in devices at the “edge”).
Some specific tools and techniques that can be applied to CMS to generate smart content include these:
Natural language understanding and natural language generation
Topic modeling (including topic drift and topic emergence detection)
Consequently, smart content thrives at the convergence of AI and content. Labels are curated and stored with the content, thus enabling curation, cataloguing (indexing), search, delivery, orchestration, and use of content and data in AI applications, including knowledge-driven decision-making and autonomous operations. Techniques that both enable (contribute to) and benefit from smart content are content discovery, machine learning, knowledge graphs, semantic linked data, semantic data integration, knowledge discovery, and knowledge management. Smart content thus meets the needs for digital business operations and autonomous (AI and intelligent automation) activities, which must devour streams of content and data – not just any content, but smart content – the right (semantically identified) content delivered at the right time in the right context.
The
four tactical steps in a smart content strategy include:
Characterize and contextualize the patterns, events, and entities in the content collection with semantic (contextual) tags, annotation, and metadata (TAM).
Collect, curate, and catalog (i.e., index) each TAM component to make it searchable, accessible, and reusable.
Deliver the right content at the right time in the right context to the decision agent.
Decide and act on the delivered insights and knowledge.
Remember,
do not be content with your current content management strategy. But discover
and deliver the perfect smart content that perfects your digital business outcomes.
Smart content strategy can save end-users countless minutes in a typical
workday, and that type of business process improvement certainly is not too
minute for consideration.
The year 2020 was remarkably different in many
ways from previous years. In at least one way, it was not different, and that was
in the continued development of innovations that are inspired by data. This
steady march of data-driven innovation has been a consistent characteristic of
each year for at least the past decade. These data-fueled innovations come in
the form of new algorithms, new technologies, new applications, new concepts,
and even some “old things made new again”.
I provide below my perspective on what was
interesting, innovative, and influential in my watch list of the Top 10 data
innovation trends during 2020.
1) Automated Narrative Text Generation
tools became incredibly good in 2020, being able to create scary good “deep
fake” articles. The GPT-3 (Generative Pretrained Transformer, 3rd generation
text autocomplete) algorithm made headlines since it demonstrated that it can
start with a very thin amount of input (a short topic description, or a question),
from which it can then generate several paragraphs of narrative that are very
hard (perhaps impossible) to distinguish from human-generated text. However, it
is far from perfect, since it certainly does not have reasoning skills, and it
also loses its “train of thought” after several paragraphs (e.g., by making
contradictory statements at different places in the narrative, even though the
statements are nicely formed sentences).
2) MLOps became the expected norm
in machine learning and data science projects. MLOps takes the
modeling, algorithms, and data wrangling out of the experimental “one off”
phase and moves the best models into deployment and sustained operational phase.
MLOps “done right” addresses sustainable model operations, explainability,
trust, versioning, reproducibility, training updates, and governance (i.e., the
monitoring of very important operational ML characteristics: data drift,
concept drift, and model security).
3) Concept drift by COVID – as mentioned above, concept drift is being addressed in machine learning and data science projects by MLOps, but concept drift is so much bigger than MLOps. Specifically, it feels to many of us like a decade of business transformation was compressed into the one year 2020. How and why businesses make decisions, customers make decisions, and anybody else makes decisions became conceptually and contextually different in 2020. Customer purchase patterns, supply chain, inventory, and logistics represent just a few domains where we saw new and emergent behaviors, responses, and outcomes represented in our data and in our predictive models. The old models were not able to predict very well based on the previous year’s data since the previous year seemed like 100 years ago in “data years”. Another example was in new data-driven cybersecurity practices introduced by the COVID pandemic, including behavior biometrics (or biometric analytics), which were driven strongly by the global “work from home” transition, where many insecurities in networks, data-sharing, and collaboration / communication tools were exposed. Behavior biometrics may possibly become the essential cyber requirement for unique user identification, finally putting weak passwords out of commission. Data and network access controls have similar user-based permissions when working from home as when working behind the firewall at your place of business, but the security checks and usage tracking can be more verifiable and certified with biometric analytics. This is critical in our massively data-sharing world and enterprises.
4) AIOps increasingly became a focus in AI
strategy conversations. While it is similar to MLOps, AIOps is less focused on
the ML algorithms and more focused on automation and AI applications in the
enterprise IT environment – i.e., focused on operationalizing AI, including
data orchestration, the AI platform, AI outcomes monitoring, and cybersecurity
requirements. AIOps appears in discussions related to ITIM (IT infrastructure
monitoring), SIEM (security information and event management), APM (application
performance monitoring), UEBA (user and entity behavior analytics), DevSecOps,
Anomaly Detection, Rout Cause Analysis, Alert Generation, and related
enterprise IT applications.
5) The emergence of Edge-to-Cloud
architectures clearly began pushing Industry 4.0 forward (with some folks now starting
to envision what Industry 5.0 will look like). The Edge-to-Cloud architectures are
responding to the growth of IoT sensors and devices everywhere, whose
deployments are boosted by 5G capabilities that are now helping to
significantly reduce data-to-action latency. In some cases, the analytics and
intelligence must be computed and acted upon at the edge (Edge Computing, at
the point of data collection), as in autonomous vehicles. In other cases, the
analytics and insights may have more significant computation requirements and
less strict latency requirements, thus allowing the data to be moved to larger
computational resources in the cloud. The almost forgotten “orphan”
in these architectures, Fog Computing (living between edge and cloud), is now moving
to a more significant status in data and analytics architecture design.
6) Federated Machine Learning (FML)
is another “orphan” concept (formerly called Distributed Data Mining
a decade ago) that found new life in modeling requirements, algorithms, and
applications in 2020. To some extent, the pandemic contributed to this
because FML enforces data privacy by essentially removing
data-sharing as a requirement for model-building across multiple datasets,
multiple organizations, and multiple applications. FML model training is done incrementally
and locally on the local dataset, with the meta-parameters of the local models
then being shared with a centralized model-inference engine (which does not see
any of the private data). The centralized ML engine then builds a global model,
which is communicated back to the local nodes. Multiple iterations in
parameter-updating and hyperparameter-tuning can occur between local nodes and
the central inference engine, until satisfactory model performance is achieved.
All through these training stages, data privacy is preserved, while allowing
for the generation of globally useful, distributable, and accurate models.
7) Deep learning (DL) may not be “the one
algorithm to dominate all others” after all. There was some research published
earlier in 2020 that found that traditional, less complex algorithms can be
nearly as good or better than deep learning on some tasks. This could be yet
another demonstration of the “no free lunch theorem”, which basically states
that there is no single universal algorithm that is the best for all problems.
Consequently, the results of the new DL research may not be so surprising, but
they certainly prompt us with necessary reminders that sometimes simple is
better than complexity, and that the old saying is often still true: “perfect
is the enemy of good enough.”
8) RPA (Robotic Process Automation) and
intelligent automation were not new in 2020, but the surge in their use
and in the number of providers was remarkable. While RPA is more rule-based
(informed by business process mining, to automate work tasks that have very
little variation), intelligent automation is more data-driven, adaptable, and
self-learning in real-time. RPA mimics human actions, by repetition of routine
tasks based on a set of rules. Intelligent automation simulates human
intelligence, which responds and adapts to emergent patterns in new data, and
which is capable of learning to automate non-routine tasks. Keep an eye on the
intelligent automation space for new and exciting developments to come in the
near future around hyperautomation and enterprise intelligence, such as the
emergence of learning business systems that learn and adapt their processes
based on signals in enterprise data across numerous business functions:
finance, marketing, HR, customer service, production, operations, sales, and
management.
9) The Rise of Data Literacy initiatives,
imperatives, instructional programs, and institutional awareness in 2020 was
one of the two most exciting things that I witnessed during the year. (The
other one of the two is next on my list.) I have said for nearly 20 years that
data literacy must become a key component of education at all levels and an
aptitude of nearly all employees in all organizations. The world is data,
revolves around data, produces and consumes massive quantities of data, and
drives innovative emerging technologies that are inspired by, informed by, and
fueled by data: augmented reality (AR), virtual reality (VR), autonomous
vehicles, computer vision, digital twins, drones, robotics, AI, IoT, hyperautomation,
virtual assistants, conversational AI, chatbots, natural language understanding
and generation (NLU, NLG), automatic language translation, 4D-printing, cyber
resilience, and more. Data literacy is essential for future of work, future
innovation, work from home, and everyone that touches digital information.
Studies have shown that organizations that are not adopting data literacy
programs are not only falling behind, but they may stay behind, their
competition. Get on board with data literacy! Now!
10) Observability emerged as one of the hottest and (for me) most exciting developments of the year. Do not confuse observability with monitoring (specifically, with IT monitoring). The key difference is this: monitoring is what you do, and observability is why you do it. Observability is a business strategy: what you monitor, why you monitor it, what you intend to learn from it, how it will be used, and how it will contribute to business objectives and mission success. But the power, value, and imperative of observability does not stop there. Observability meets AI – it is part of the complete AIOps package: “keeping an eye on the AI.” Observability delivers actionable insights, context-enriched data sets, early warning alert generation, root cause visibility, active performance monitoring, predictive and prescriptive incident management, real-time operational deviation detection (6-Sigma never had it so good!), tight coupling of cyber-physical systems, digital twinning of almost anything in the enterprise, and more. And the goodness doesn’t stop there. The emergence of standards, like OpenTelemetry, can unify all aspects of your enterprise observability strategy: process instrumentation, sensing, metrics specification, context generation, data collection, data export, and data analysis of business process performance and behavior monitoring in the cloud. This plethora of benefits is a real game-changer for open-source self-service intelligent data-driven business process monitoring (BPM) and application performance monitoring (APM), feedback, and improvement. As mentioned above, monitoring is “what you are doing”, and observability is “why you are doing it.” If your organization is not having “the talk” about observability, now is the time to start – to understand why and how to produce business value through observability into the multitude of data-rich digital business applications and processes all across the modern enterprise. Don’t drown in those deep seas of data. Instead, develop an Observability Strategy to help your organization ride the waves of data, to help your business innovation and transformation practices move at the speed of data.
In summary, my top 10 data innovation trends from 2020 are:
GPT-3
MLOps
Concept Drift by COVID
AIOps
Edge-to-Cloud and Fog
Computing
Federated Machine
Learning
Deep Learning meets
the “no free lunch theorem”
RPA and Intelligent
Automation
Rise of Data Literacy
Observability
If
I were to choose what was hottest trend in 2020, it would not be a single item in
this top 10 list. The hottest trend would be a hybrid (convergence) of several of
these items. That hybrid would include: Observability, coupled with Edge and
the ever-rising ubiquitous IoT (sensors on everything), boosted by 5G and cloud
technologies, fueling ever-improving ML and DL algorithms, all of which are
enabling “just-in-time” intelligence and intelligent automation (for
data-driven decisions and action, at the point of data collection), deployed with
a data-literate workforce, in a sustainable and trusted MLOps environment,
where algorithms, data, and applications work harmoniously and are governed and
secured by AIOps.
If we
learned anything from the year 2020, it should be that trendy technologies do not
comprise a menu of digital transformation solutions to choose from, but there really
is only one combined solution, which is the hybrid convergence of data
innovation technologies. From my perspective, that was the single most
significant data innovation trend of the year 2020.