Pure Storage empowers enterprise AI with advanced data storage technologies and validated reference architectures for emerging generative AI use cases.
Summary
AI devours data. With award-winning AI-ready infrastructure, an AI data platform, and collaboration with NVIDIA, Pure Storage is delivering solutions and services that enable organizations to manage the high-performance data and compute requirements of enterprise AI.
AI Then and AI Now
They (some wise anonymous folks out there) say that there is a time and place for everything. They also say there is a season for every purpose. I believe that the time, place, and season for artificial intelligence (AI) data platforms have arrived. To see this, look no further than Pure Storage, whose core mission is to “empower innovators by simplifying how people consume and interact with data.”
In the past, it was sufficient to bring order to the randomness of enterprise data collection through applications of technology resources (databases and storage devices) that were aimed primarily at organizing, storing, indexing, and managing enterprise information assets for single purposes or single business units. However, this data was still left mostly unexploited for its maximum potential and enterprise-wide business value.
Also in the past, it was sufficient for business automation to consist primarily of rigid rule-based robotic non-adaptive repetition of processes and fixed tasks, requiring very little (if any) new knowledge input (i.e., live data consumption) or real-time adaptation to changing business conditions.
And also in the past, it was sufficient for AI to be relegated to academic researchers or R&D departments of big organizations who mostly produced research reports or journal papers, and not much else.
Fast-forward to 2024 and we see a totally different landscape: massive data sets feeding dynamic cross-enterprise processes, increasing automation and dynamic adaption of complex multi-step tasks, and ubiquitous value-producing applications of AI. In particular, in the past year, generative AI has played a major role in the explosive development and growth of these transformations within enterprises.
Pure Storage Meets the Demands of Enterprise AI
To support, sustain, and assure the continued success and cost-effectiveness of the enormous data-fueled AI-powered transformations in such a rapidly changing environment, Pure Storage has stepped up their delivery of an incredible array of award-winning AI-ready infrastructure (AIRI//S™) products and services with an AI data platform that provides the fundamental AI environment for enterprise data management (storage, access, orchestration, delivery), hyperscaled AI training, and AI inference on demand (on-prem, in data centers, at edge sites, and in micro edge devices).
One example of Pure Storage’s advantage in meeting AI’s data infrastructure requirements is demonstrated in their DirectFlash® Modules (DFMs), with an estimated lifespan of 10 years and with super-fast flash storage capacity of 75 terabytes (TB) now, to be followed up with a roadmap that is planning for capacities of 150TB, 300TB, and beyond. Another example is Pure Storage’s FlashBlade® which was invented to help companies handle the rapidly increasing amount of unstructured data coming into greater use, as required in the training of multi-modal AI models. One more example is Pure Storage’s development of non-disruptive upgrades (NDUs), a feature of Pure Storage’s architecture that permits upgrades and expansion of the data infrastructure with no impact on data availability or performance, and with no downtime or data migrations.
Pure Storage’s Announcements at GTC 2024
The preceding examples are industry-leading and exemplary, and yet there’s still more. At the NVIDIA GTC 2024 conference, Pure Storage announced so much more! Here are a few more details on some of those announcements.
A Data Platform for AI
Data is the fuel for AI, because AI devours data—finding patterns in data that drive insights, decisions, and action. Ease of data orchestration (ingest, cleaning, transformation, discovery, access, exploration, delivery, training, inference, deployment) is essential for data-devouring AI products and services. A data platform for AI is key to innovation and long-term affordability, scalability, sustainability, and advancement of enterprise AI applications. Anything less than a complete data platform for AI is a deal-breaker for enterprise AI. Pure Storage provides the ideal data platform for AI, as it provides unified storage for structured and unstructured data and provides enterprise data services for Kubernetes, supporting the entire AI data pipeline, because storage matters!
At GTC 2024, Pure demonstrated the features of their data platform for AI, specifically highlighting these benefits and features of the platform: (a) Helps organizations accelerate model training and inference; (b) Improves operational efficiency for AI/IT infrastructure teams, as well as AI/ML developers and engineers; (c) Delivers cost and energy efficiency as an enterprise scales their AI operations; and (d) Provides an AI storage platform that delivers ultimate reliability and is built to handle all future AI storage needs.
Optimizing GenAI Apps with RAG—Pure Storage + NVIDIA for the Win!
One of the most popular techniques associated with generative AI (GenAI) this past year has been retrieval-augmented generation (RAG). RAG is the essential link between two things: (a) the general large language models (LLMs) available in the market, and (b) a specific organization’s local knowledge base. In deep learning applications (including GenAI, LLMs, and computer vision), a data object (e.g., document, image, video, audio clip) is reduced (transformed) to a condensed vector representation using deep neural networks. The knowledge base then becomes the comprehensive collection of these condensed representations of the enterprise business data repositories, stored in vector format in a vector database—Vector DB being another major data technology development finding widespread adoption this past year.
As a consequence of these activities, RAG provides the bespoke use case-specific context to an organization’s proprietary GenAI LLM applications. This contextualization of the GenAI LLM is not only enterprise-specific, local, and customized, but it is also proprietary—maintaining the privacy and security of the GenAI LLM application within the security firewalls and policies of that organization. Additionally, RAG ensures the use of an organization’s most recent data while eliminating the need for constant retraining of the LLMs. Pure Storage has worked with NVIDIA (GPU memory and GPU servers) to boost the speed, accuracy, and on-prem power of such enterprise GenAI LLM applications. Here are some specific documented results:
(a) “NVIDIA GPUs are used for compute and Pure Storage FlashBlade//S provides all-flash enterprise storage for a large vector database and its associated raw data. In a specific case [presented at GTC], the raw data consisted of a large collection of public documents, typical of a public or private document repository used for RAG.”
Pure Storage’s RAG pipeline, in conjunction with NVIDIA GPUs and NVIDIA’s NeMo Retriever collection of GenAI microservices, ensures accuracy, currency, privacy, and relevance of proprietary enterprise LLMs. Time to insight and time to action in AI applications are faster and better with Pure Storage.
OVX Validated Reference Architecture for AI-ready Infrastructures
First question: What is OVX validation? OVX is NVIDIA’s standard validation paradigm for computing systems that combine high-performance GPU acceleration, graphics, and AI with fast, low-latency networking that are used to design and power complex 3D virtual worlds and digital twins that are transforming how businesses design, simulate, and optimize complex systems and processes. In this fantastic emerging realm of breathtaking technological achievements and innovations, Pure Storage has achieved OVX validation of their reference architecture for AI-ready infrastructures. At this stage, OVX validation applies directly to the increasing business demand for GenAI workloads (including RAG, LLMs, knowledge bases, and Vector DB), full-stack ready-to-run enterprise AI infrastructure, and local proprietary custom data + AI compute, storage, and networking solutions. Note: When you see “full-stack,” read “Pure Storage + NVIDIA working together seamlessly.”
Second question: What about technical debt and the cost of “lift and shift” to these new AI-ready architectures? For Pure Storage, OVX validation also certifies that Pure Storage’s AI-ready infrastructure will run on NVIDIA GPUs and on other vendors’ servers, which is a great savings on technical debt for those organizations that operate diverse server farms. OVX validation complements Pure Storage’s certified reference architecture for NVIDIA DGX BasePOD that was announced last year as well as their FlashStack® for AI Cisco Validated Designs announced here.
Since one of the only certainties about the future is its uncertainty, it is a great benefit that Pure Storage Evergreen//One™ provides storage-as-a-service (STaaS) guarantees and enables future-proof growth with non-disruptive upgrades. That means that Pure Storage owns the hardware (“the end user doesn’t pay for it”), but the end user buys a subscription to the storage with the same agility and flexibility of public cloud storage, and with all the security, proprietary protection, and performance of on-prem all-flash sustainable infrastructure. This is Pure Storage’s SLA-guaranteed cloud-like STaaS!
More Pure Storage Announcements at GTC 2024
Pure Storage’s RAG development (described earlier) is accelerating successful AI adoption across vertical industries. Pure Storage is accomplishing this by creating vertical-specific RAGs in collaboration with NVIDIA. First, “Pure Storage has created a financial services RAG solution to summarize and query massive data sets with higher accuracy than off-the-shelf LLMs. Financial services institutions can now gain faster insight using AI to create instant summaries and analysis from various financial documents and other sources.” Pure Storage will soon release additional RAGs for healthcare and the public sector.
Expanded investment in the AI partner ecosystem: Pure Storage is further investing in its AI partner ecosystem with NVIDIA, engaging in new partnerships with independent software vendors (ISVs). Some of these investments are aimed at optimizing GPU utilization through advanced orchestration and scheduling, and others enable machine learning teams to build, evaluate, and govern their model development lifecycle. Additionally, Pure Storage is working closely with numerous AI-focused resellers and service partners to further operationalize joint customer AI deployments.
Looking at AI Now and at What’s Next
As the award-winning leader in AI-ready (and future-ready) data infrastructure, Pure Storage is collaborating with NVIDIA to empower their global customers with a proven framework to manage the high-performance data and compute requirements that these enterprises need to drive successful AI deployments, both now and into the future. Every technical leader, line of business (LOB) leader, VP of Infrastructure for AI, VP of AI/Data Science, and CDO/CTO/CAIO can benefit right now from these technologies and services.
To put all of Pure Storage’s recent accomplishments, products, services, and solutions into a single statement, I would say that Pure Storage’s primary purpose (their North Star) is to guide and accelerate their customers’ adoption of AI through the Pure Storage platform for AI.
To learn more about all of this, make connections, learn new skills, and get ready for what’s next in this rapidly evolving season of AI, be sure to register and attend the Pure//Accelerate® 2024 live event June 18-21, 2024, at Resorts World Las Vegas. The event will have a special track on “Today’s and Tomorrow’s Applications of AI.” Don’t miss it!
Register Now for Pure//Accelerate 2024
Drive your data success at Pure//Accelerate® at Resorts World Las Vegas from June 18-21. This is the premier event to make connections, learn new skills, and get ready for what’s next. Here’s a sneak peek of what to expect:
I recently attended the Splunk .conf23 conference in Las Vegas. Well, the conference was in Vegas, while I was far away in my home office watching the live conference keynote sessions online. Despite the thousands of miles (and kilometers) of separation, I could feel the excitement in the room as numerous announcements were made, individuals were honored, customer success stories were presented, and new solutions and product features were revealed. I will summarize many of those here (specifically my major learning moments), though this report cannot provide a complete review of all that was said at .conf23, primarily because I attended only the two main keynote sessions, but also because the phenomenal number of remarkable things to hear and learn in those sessions exceeded my capacity to record them all in one succinct report.
When I reviewed highlights from last year’s Splunk .conf22 conference in my summary report at that time, I focused a lot on the Splunk Observability Cloud and its incredible suite of Observability and Monitoring products and services. This reflected my strong interest in observability at that time. My strong interest hasn’t diminished, and neither has Splunk’s developments and product releases in that space, as seen in observability’s prominent mention within many of Splunk’s announcements at this year’s .conf23 event. For a detailed report on the current state of observability this year, you can access and download “The State of Observability 2023” report from Splunk. Here are four specific metrics from the report, highlighting the potentially huge enterprise system benefits coming from implementing Splunk’s observability and monitoring products and services:
Four times as many leaders who implement observability strategies resolve unplanned downtime in just minutes, not hours or days.
Leaders report one-third the number of outages per year, on average, compared to those organizations who do not implement observability and monitoring.
Leaders are 7.9x as likely to say that their ROI on observability tools far exceeded expectations.
89% of leaders are completely confident in their ability to meet their application availability and performance requirements, versus just 43% of others.
Here are my top learnings from .conf23:
Splunk announced a new strategic partnership with Microsoft Azure, thereby adding another major cloud provider to their other cloud provider partnerships, bringing Splunk products and services into more enterprises through the Azure Marketplace. This partnership also specifically extends hybrid cloud capabilities that will enhance organizations’ digital resilience, while enabling transformation, modernization, migration, and growth in all enterprise digital systems with confidence, trust, and security.
Digital resilience was a major common theme across all of the Splunk announcements this week. As I heard someone say in the keynote session, “You had me at resilience!” By providing real-time data insights into all aspects of business and IT operations, Splunk’s comprehensive visibility and observability offerings enhance digital resilience across the full enterprise. Organizations are able to monitor integrity, quality drift, performance trends, real-time demand, SLA (service level agreement) compliance metrics, and anomalous behaviors (in devices, applications, and networks) to provide timely alerting, early warnings, and other confidence measures. From these data streams, real-time actionable insights can feed decision-making and risk mitigations at the moment of need. Such prescriptive capabilities can be more proactive, automated, and optimized, making digital resilience an objective fact for businesses, not just a business objective. I call that “digital resilience for the win!”
Several Splunk customer success stories were presented, with interesting details of their enterprise systems, the “back stories” that led them to Splunk, the transformations that have occurred since Splunk integration, and the metrics to back up the success stories. Customers presenting at .conf23 included FedEx, Carnival Corporation & plc, Inter IKEA, and VMware. Here are a few of the customer performance metrics presented (measuring performance changes following the Splunk integration into the customers’ enterprise systems): 3X Faster Response Time, 90% Faster Mean Time to Remediation, and 60X Faster Insights.
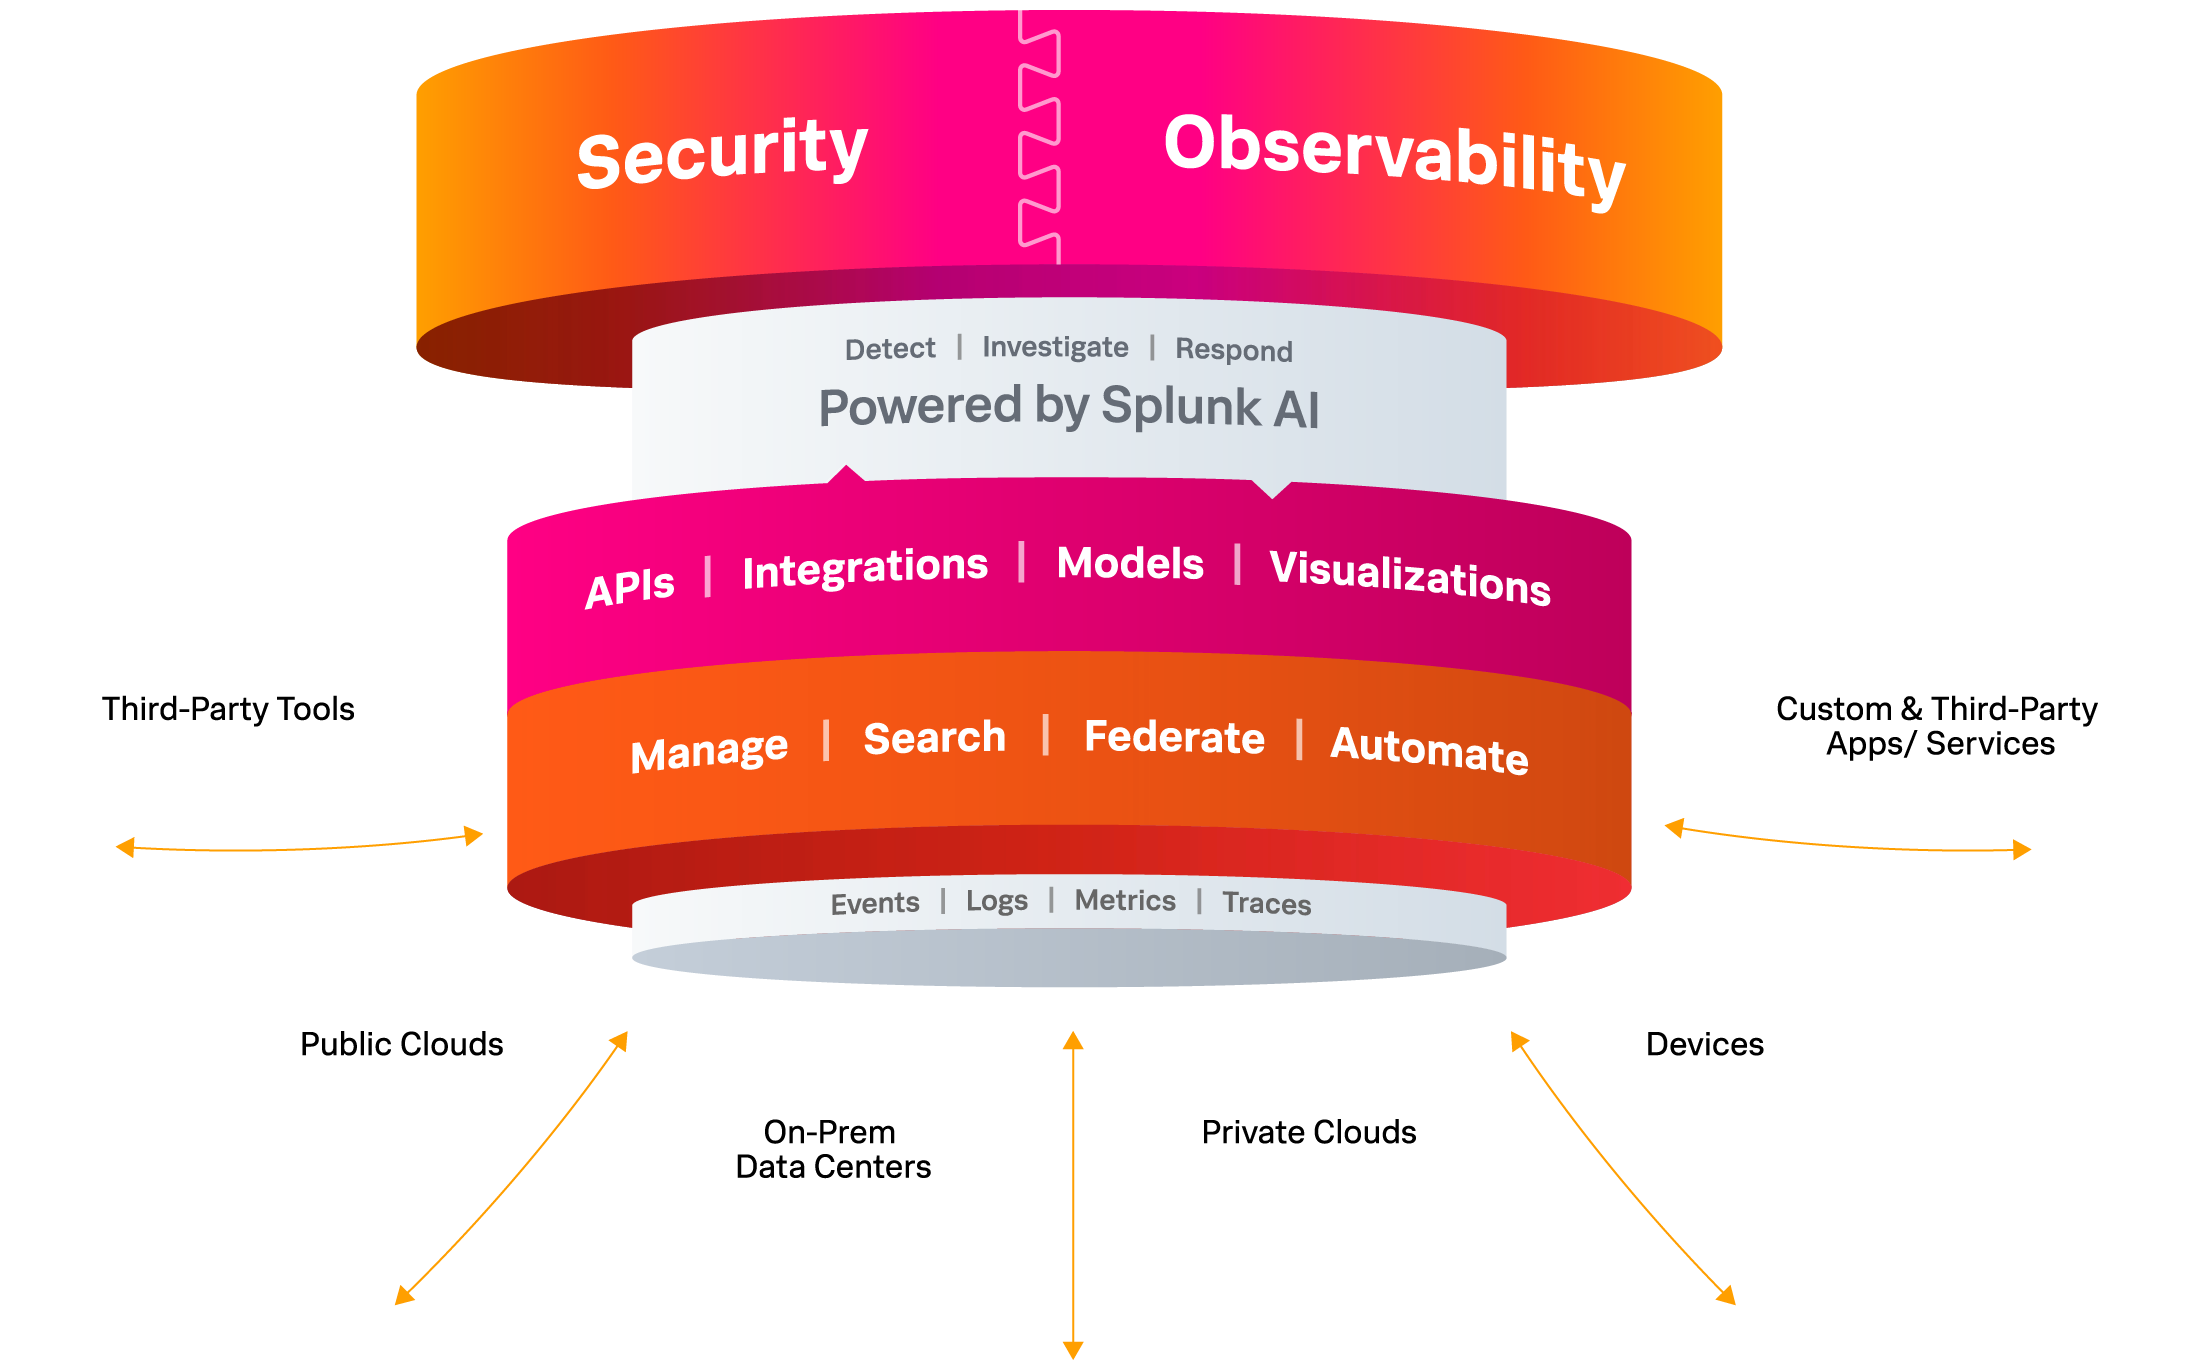
Splunk has brought greater integration and customer ease-of-use of their offerings through a Unified Security and Observability Platform. This unified operations center (Splunk Mission Control) amplifies the efficiency (time to problem resolution) and effectiveness (number of time-critical problems resolved) of ITOps and DevOps teams, requiring fewer manual steps in correlating data streams from multiple systems in order to determine the root cause of an incident. Further enhancing the user experience, the unified platform provides end-to-end enterprise systems visibility and federated search across those systems.
Splunk Mission Control (just mentioned above) – Splunk describes it best: “Splunk Mission Control brings together Splunk’s industry-leading security technologies that help customers take control of their detection, investigation and response processes. Splunk’s security offerings include security analytics (Splunk Enterprise Security), automation and orchestration (Splunk SOAR), and threat intelligence capabilities. In addition, Splunk Mission Control offers simplified security workflows with processes codified into response templates. With Splunk Mission Control, security teams can focus on mission-critical objectives, and adopt more proactive, nimble security operations.”
Model-Assisted Threat Hunts, also known as Splunk M-ATH, is Splunk’s brand name for machine learning-assisted threat hunting and mitigation. M-ATH is part of the PEAK (Prepare, Execute, and Act with Knowledge) Framework, that consists of three types of hunts: (1) Hypothesis-driven (i.e., testing for hypothesized threats, behaviors, and activities), (2) Baseline (i.e., search for deviations from normal behaviors through EDA: Exploratory Data Analysis), and (3) M-ATH (i.e., automation of the first two type of hunts, using AI and machine learning). M-ATH includes ML-assisted adaptive thresholding and outlier handling, for improved alerts (i.e., faster alerting with fewer false positives and false negatives).
“Don’t be a SOAR loser!” Okay, that’s what one of the Splunk speakers said at .conf23. By that, he was referring to being a winner with Splunk SOAR: Security Orchestration, Automation and Response. SOAR orchestrates, prioritizes, and automates security teams (SecOps) workflows and tasks, enabling more accurate, more complete, smarter, and faster response to security incidents. As Splunk says, “Automate so you can innovate.” Isn’t that always a business truth? If you can free your analyst teams to think outside the box, hypothesize, innovate, and test new methods and solutions, then that is the sure path to being a SAFE (Security Analytics For the Enterprise) winner: soar with SOAR! While SIEM (Security Information and Event Management) aims to manage the data flows, logging, audits, alerted events, and incident responses, SOAR automates these security activities (using machine learning and AI), monitors the data and events for anomalous behaviors, classifies (prioritizes) the events, and then orchestrates optimized security operations and incident responses (using playbooks).
Saving my best two .conf23 learning moments for last, first up is Splunk Edge Hub. This is a physical device, in the IoT (Internet of Things) family of sensors, that collects and streams data from the edge (i.e., from edge devices, cameras, streaming data sources, monitoring systems, and sensors of all types) into Splunk systems that go to work on those data: security operations, anomaly detection, event classification, trend detection, drift detection, behavior detection, and any other edge application that requires monitoring and observability, with an injection of machine learning and AI for intelligent data understanding, classification, prioritization, optimization, and automation. Since business thrives at the edge (through insights discovery and actionable analytics at the point—time and place—of data collection), an edge hub is just what a business needs to mitigate risk, ensure visibility, escalate incidents for review, optimize the operational response, and monitor the associated activities (causes and effects).
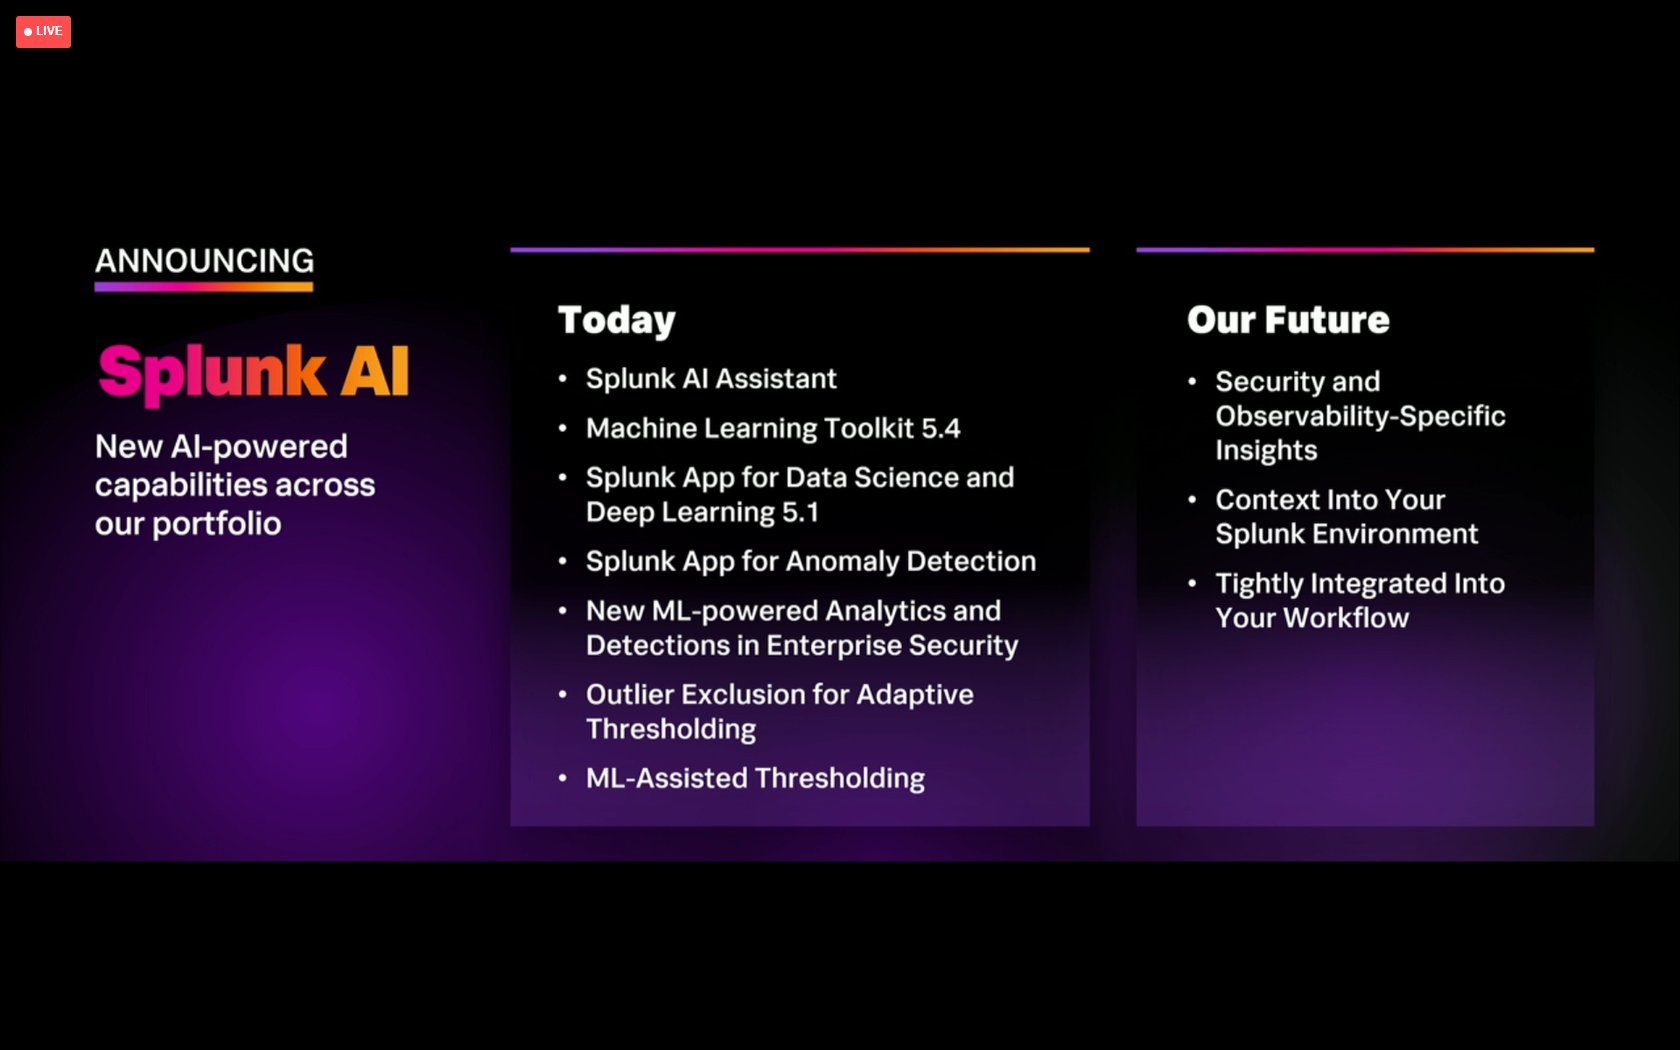
Splunk AI Assistant– Boom! This is the brilliant and innovative introduction of an AI assistant into Splunk products, services, and user workflows. This includes the latest and best of AI — generative AI and natural language interfaces integrated within the Splunk platform. This product release most definitely enables and “catalyzes digital resilience in cybersecurity and observability.” This is not just a product release. It is a “way of life” and “a way of doing business” with Splunk products and services. AI is not just a tacked-on feature, but it is a fundamental characteristic and property of those products’ features. Splunk AI increases productivity, efficiency, effectiveness, accuracy, completeness, reliability, and (yes!) resilience across all enterprise SecOps, ITOps, and AIOps functions, tasks, and workflows that are powered by Splunk. Generative AI enables the Splunk SecOps and ITOps tasks, workflows, processes, insights, alerts, and recommended actions to be domain-specific and customer-specific. It automatically detects anomalies and focuses attention where it’s needed most, for that business in that domain, while providing full control and transparency on which data and how data are used to train the AI, and how much control is assigned to the AI (by maintaining “human in the loop” functionality). With regard to the natural language features, Splunk AI Assistant leverages generative AI to provide an interactive chat experience and helps users create SPL (Splunk Processing Language) queries using natural language. This feature not only improves time-to-value, but it “helps make SPL more accessible, further democratizing an organization’s access to, and insights from, its data” – and that includes automated recommendations to the user for “next best action”, which is a great learning prompt for new Splunk users and SecOps beginners.
For a peek into my peak real-time experiences at .conf23, see my #splunkconf23 social thread on Twitter at https://bit.ly/3DjI5NU. Actually, go there and explore, because there is so much more to see there than I could cover in this one report.
Closing thoughts – AI (particularly generative AI) has been the hottest tech topic of the year, and Splunk .conf23 did not disappoint in their coverage of this topic. The agendas for some events are filled with generic descriptions that sing the praises of generative AI. This Splunk event .conf23 provided something far more beneficial and practical: they presented demonstrably valuable business applications of generative AI embedded in Splunk products, which deliver a convincing Splunk-specific productivity enhancer for new and existing users of Splunk products. When the tech hype train is moving as fast as it has been this year, it is hard for a business to quickly innovate, incorporate, and deliver substantially new features that use the new tech within their legacy products and services, but Splunk has done so, with top marks for those achievements.
Disclaimer: I was compensated as an independent freelance media influencer for my participation at the conference and for this article. The opinions expressed here are entirely my own and do not represent those of Splunk or of any Splunk partners. Any misrepresentations of the products and services mentioned in my statements are entirely my own responsibility. Nothing here should be construed as an offer to sell or as financial advice of any kind. My comments are entirely of a technical nature, focused on the technical capabilities of the items mentioned in the article.
We discussed in another article the key role of enterprise data infrastructure in enabling a culture of data democratization, data analytics at the speed of business questions, analytics innovation, and business value creation from those innovative data analytics solutions. Now, we drill down into some of the special characteristics of data and enterprise data infrastructure that ignite analytics innovation.
First, a little history – years ago, at the dawn of the big data age, there was frequent talk of the three V’s of big data (data’s three biggest challenges): volume, velocity, and variety. Though those discussions are now considered “ancient history” in the current AI-dominated era, the challenges have not vanished. In fact, they have grown in importance and impact.
While massive data volumes appear less frequently now in strategic discussions and are being tamed with excellent data infrastructure solutions from Pure Storage, the data velocity and data variety challenges remain in their own unique “sweet spot” of business data strategy conversations. We addressed the data velocity challenges and solutions in our previous article: “Solving the Data Daze – Analytics at the Speed of Business Questions”. We will now take a look at the data variety challenge, and then we will return to modern enterprise data infrastructure solutions for handling all big data challenges.
Okay, data variety—what is there about data variety that makes it such a big analytics challenge? This challenge often manifests itself when business executives ask a question like this: “what value and advantages will all that diversity in data sources, venues, platforms, modalities, and dimensions actually deliver for us in order to outweigh the immense challenges that high data variety brings to our enterprise data team?”
Because nearly all organizations collect many types of data from many different sources for many business use cases, applications, apps, and development activities, consequently nearly every organization is facing this dilemma.
Data is more than just another digital asset of the modern enterprise. It is an essential asset. And data is now a fundamental feature of any successful organization. Beyond the early days of data collection, where data was acquired primarily to measure what had happened (descriptive) or why something is happening (diagnostic), data collection now drives predictive models (forecasting the future) and prescriptive models (optimizing for “a better future”). Business leaders need more than backward-looking reports, though those are still required for some stakeholders and regulators. Leaders now require forward-looking insights for competitive market advantage and advancement.
So, what happens when the data flows are not quarterly, or monthly, or even daily, but streaming in real-time? The business challenges then become manifold: talent and technologies now must be harnessed, choreographed, and synchronized to keep up with the data flows that carry and encode essential insights flowing through business processes at light speed. Insights discovery (powered by analytics, data science, and machine learning) drives next-best decisions, next-best actions, and business process automation.
In the early days of the current data analytics revolution, one would often hear business owners say that they need their data to move at the speed of business. Well, it soon became clear that the real problem was the reverse: how can we have our business move at the speed of our data? Fortunately, countless innovative products and services in the data analytics world have helped organizations in that regard, through an explosion in innovation around data analytics, data science, data storytelling, data-driven decision support, talent development, automation, and AI (including the technologies associated with machine learning, deep learning, generative AI, and ChatGPT).
We live in a data-rich, insights-rich, and content-rich world. Data collections are the ones and zeroes that encode the actionable insights (patterns, trends, relationships) that we seek to extract from our data through machine learning and data science. The insights are used to produce informative content for stakeholders (decision-makers, business users, and clients). Content includes reports, documents, articles, presentations, visualizations, video, and audio representations of the insights and knowledge that have been extracted from data.
We could further refine our opening statement to say that our business users are too often in a state of being data-rich, but insights-poor, and content-hungry. With all the data in and around the enterprise, users would say that they have a lot of information but need more insights to assist them in producing better and more informative content. This is where we dispel an old “big data” notion (heard a decade ago) that was expressed like this: “we need our data to run at the speed of business.” Instead, what we really need is for our business to run at the speed of data. It is a major digital transformation challenge for businesses to keep up with data flows coming from a multitude of diverse sources, in different formats, at different cadences, on different dimensions of the enterprise, captured “safely” in different business silos. Transforming data to actionable insights and informative content needs some help!
AI is now helping in all these steps – not simply because it is “Artificial” intelligence, but primarily because AI is a tool for assisted, amplified, and augmented intelligence (the “new AI”) and because AI powers accelerated and automated intelligence, in order to deliver actionable intelligence. It appears that it’s AI everywhere all the time.
AI can help business users extract and produce (i.e., generate) informative content from insights. Plus, AI can also help find key insights encoded in data. And AI can help users find the appropriate data that they need from across the enterprise. In the language of Information Retrieval, AI delivers both high Recall (“did I get all the data that I need?”) and high Precision (“did I get only the data that I need?).
Discover the essential data – that’s AI.
Extract the essential insights from the data – that’s AI.
Produce essential content from the insights – that’s AI.
Well, okay, we can slap the “AI” label on everything, but what good is that? How are we helped when we board the AI hype train? In fact, by putting a single label like AI on all the steps of a data-driven business process, we have effectively not only blurred the process, but we have also blurred the particular characteristics that make each step separately distinct, uniquely critical, and ultimately dependent on specialized, specific technologies and business domain expertise at each step. This is where SAP Datasphere (the next generation of SAP Data Warehouse Cloud) comes in.
The new SAP Datasphere comprehensive data service provides powerful, seamless, and scalable access across the enterprise, across business departments, and across business silos to the specific mission-critical business data collection(s) that are needed for each unique business use case: access to external insights from data on the marketplace and competitors, access to internal insights from data on business processes and enterprise resources, and access to insights on customer-facing business products and services at the intersection of internal and external data sources.
So, if your business users don’t have access to the right data in the right context at the right time for the right business questions, then the whole business data workflow breaks down. SAP Datasphere has arrived to address those pain points, by enabling discovery, access, and integration of the heterogeneous data distributed across the enterprise. And so begins the process of insight discovery and content creation that meets the most significant, timely, and case-specific needs of decision-makers, business knowledge workers, and other stakeholders.
The release of SAP Datasphere was launched and announced globally on March 8, 2023. Live online presentations, demos, and customer testimonials were complemented with new content posted at sap.com/datasphere. Here are just 10 of the many key features of Datasphere that were covered during the launch day announcements:
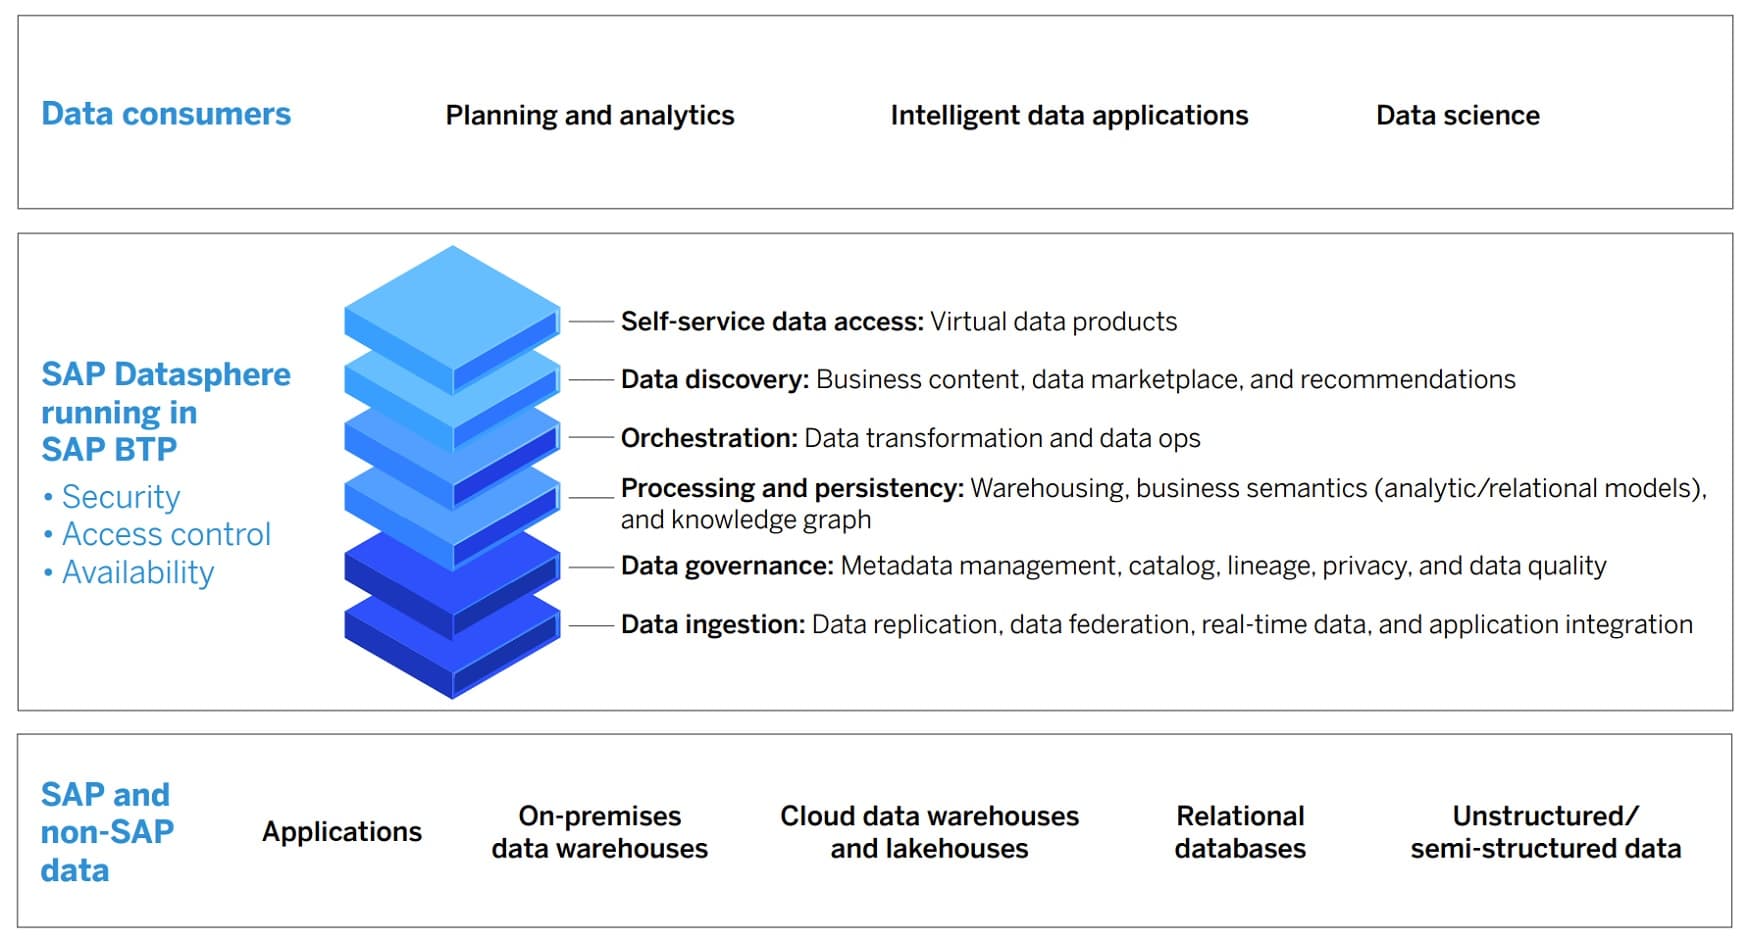
Datasphere works with the SAP Analytics Cloud and runs on the existing SAP BTP (Business Technology Platform), with all the essential features: security, access control, high availability.
Datasphere accesses and integrates both SAP and non-SAP data sources into end-users’ data flows, including on-prem data warehouses, cloud data warehouses and lakehouses, relational databases, virtual data products, in-memory data, and applications that generate data (such as external API data loads).
Datasphere manages and integrates structured, semi-structured, and unstructured data types.
Datasphere empowers data democratization, by providing all business users with self-service data access, including virtual data products that can be stored, re-used, and shared.
Datasphere is a data discovery tool with essential functionalities: recommendations, data marketplace, and business content (i.e., incorporates the business context of the data and data products that are being recommended and delivered).
Datasphere goes beyond the “big three” data usage end-user requirements (ease of discovery, access, and delivery) to include data orchestration (data ops and data transformations) and business data contextualization (semantics, metadata, catalog services).
Datasphere is an enhanced data warehousing service that includes business semantics (through both analytic and relational models) and a knowledge graph (linking business content with business context).
Datasphere provides full-spectrum data governance: metadata management, data catalogs, data privacy, data quality, and data lineage (provenance) tracking.
Datasphere provides all the outgoing data orchestration functions and incoming data ingestion functions, including replication, federation, real-time stream processing, and application integration.
Datasphere is not just for data managers. It thrives with data consumers, who are doing planning, analytics, data science, and developing intelligent data applications – by providing those users with an end-to-end view of their data landscape in a trusted, secure, and actionable data environment.
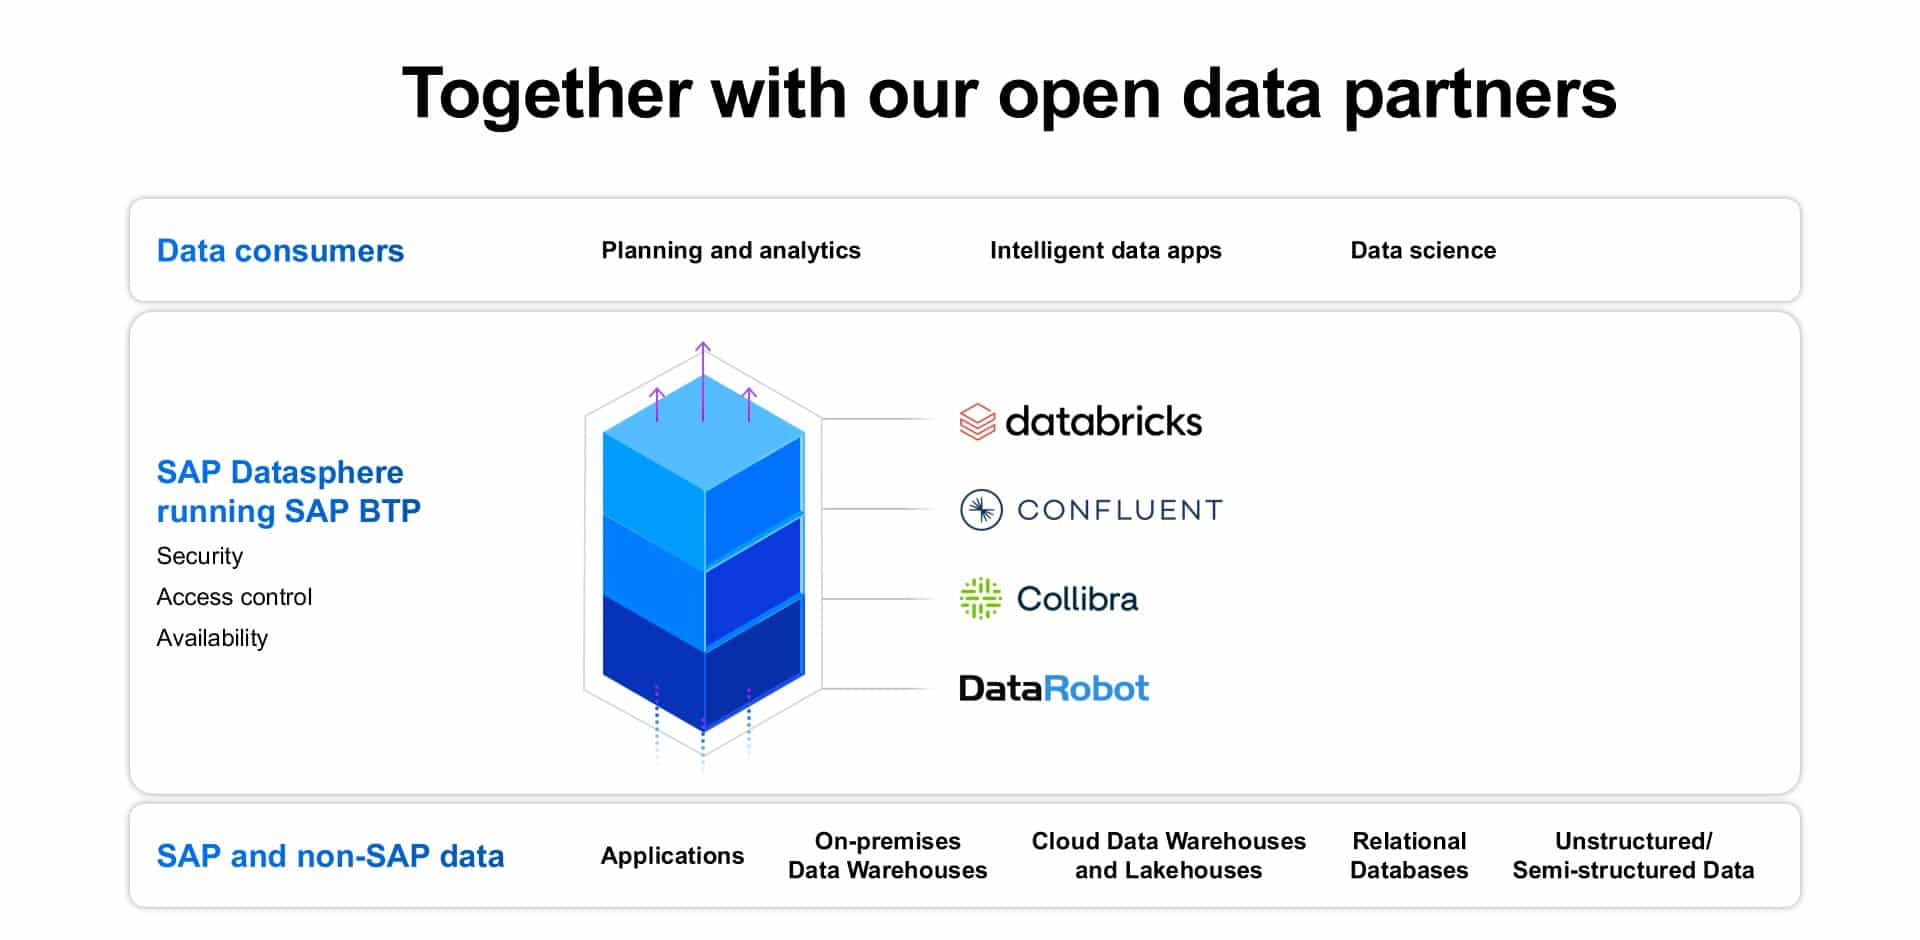
SAP also announced key partners that further enhance Datasphere as a powerful business data fabric. These partners are:
Collibra – providing data governance and discovery (metadata, catalogs) across the entire data landscape.
Confluent – providing access and discovery across real-time event data and streaming data. This emphatically addresses the “data in motion” challenge of enabling “business to run at the speed of data.”
Databricks – providing the complete business context across the evolved Data Warehouse Cloud – the new Data Lakehouse platform.
DataRobot – provides the AI, machine learning (ML), and AutoML capabilities that address the augmented intelligence requirements described at the beginning of this article.
I will finish with three quotes. The first is SAP customer testimonial from Mr. David Johnston, the Chief Information Officer at Messer Americas (leading provider of industrial and medical gases for over 120 years):
“The [Datasphere] business data fabric architecture enables us to bring SAP and non-SAP data together in the seamless and self-service way we’ve been envisioning. SAP Datasphere provided us with a solution to build a harmonized layer, or business data fabric, across SAP and non-SAP, cloud or on-premise data sources, making the best use of our existing investments [in both SAP and non-SAP data services].”
The second quote is from independent analyst Tony Baer:
“SAP’s goal is not simply pairing a data transformation factory with a data warehouse, but instead delivering a service that preserves the context of source data. As you would guess, maintaining context relies on metadata. The challenge is that when you use existing tools for replicating, moving and transforming data, the metadata typically does not usually go along with it. … SAP’s applications are a rich treasure store for business data and the process semantics that go with them. So, it’s logical that SAP has expanded on the business semantic layer of its Data Warehouse Cloud to deliver a data fabric that surfaces the metadata in business terms.”
The third quote is from Juergen Mueller, SAP Chief Technology Officer and member of the Executive Board of SAP SE:
“With SAP customers generating 87% of total global commerce, SAP data is among a company’s most valuable business assets and is contained in the most important functions of an organization, from manufacturing to supply chains, finance, human resources and more. We want to help our customers take the next step to easily and confidently integrate SAP data with non-SAP data from third-party applications and platforms, unlocking entirely new insights and knowledge to bring digital transformation to another level.”
Read, take a tour, try the free tier, deep dive, and learn more about SAP Datasphere here:
I recently attended the Splunk .conf22 conference. While the event was live in-person in Las Vegas, I attended virtually from my home office. Consequently I missed the incredible in-person experience of the brilliant speakers on the main stage, the technodazzle of 100’s of exhibitors’ offerings in the exhibit arena, and the smooth hip hop sounds from the special guest entertainer — guess who?
What I missed in-person was more than compensated for by the incredible online presentations by Splunk leaders, developers, and customers. If you have ever attended a major expo at one of the major Vegas hotels, you know that there is a lot of walking between different sessions — literally, miles of walking per day. That’s good for you, but it often means that you don’t attend all of the sessions that you would like because of the requisite rushing from venue to venue. None of that was necessary on the Splunk .conf22 virtual conference platform. I was able to see a lot, learn a lot, be impressed a lot, and ponder a lot about all of the wonderful features, functionalities, and future plans for the Splunk platform.
One of the first major attractions for me to attend this event is found in the primary descriptor of the Splunk Platform — it is appropriately called the Splunk Observability Cloud, which includes an impressive suite of Observability and Monitoring products and services. I have written and spoken frequently and passionately about Observability in the past couple of years. For example, I wrote this in 2021:
“Observability emerged as one of the hottest and (for me) most exciting developments of the year. Do not confuse observability with monitoring (specifically, with IT monitoring). The key difference is this: monitoring is what you do, and observability is why you do it. Observability is a business strategy: what you monitor, why you monitor it, what you intend to learn from it, how it will be used, and how it will contribute to business objectives and mission success. But the power, value, and imperative of observability does not stop there. Observability meets AI – it is part of the complete AIOps package: ‘keeping an eye on the AI.’ Observability delivers actionable insights, context-enriched data sets, early warning alert generation, root cause visibility, active performance monitoring, predictive and prescriptive incident management, real-time operational deviation detection (6-Sigma never had it so good!), tight coupling of cyber-physical systems, digital twinning of almost anything in the enterprise, and more. And the goodness doesn’t stop there.”
The dominant references everywhere to Observability was just the start of awesome brain food offered at Splunk’s .conf22 event. Here is a list of my top moments, learnings, and musings from this year’s Splunk .conf:
Observability for Unified Security with AI (Artificial Intelligence) and Machine Learning on the Splunk platform empowers enterprises to operationalize data for use-case-specific functionality across shared datasets. (Reference)
The latest updates to the Splunk platform address the complexities of multi-cloud and hybrid environments, enabling cybersecurity and network big data functions (e.g., log analytics and anomaly detection) across distributed data sources and diverse enterprise IT infrastructure resources. (Reference)
Splunk Enterprise 9.0 is here, now! Explore and test-drive it (with a free trial) here.
The new Splunk Enterprise 9.0 release enables DevSecOps users to gain more insights from Observability data with Federated Search, with the ability to correlate ops with security alerts, and with Edge Management, all in one platform. (Reference)
Security information and event management (SIEM) on the Splunk platform is enhanced with end-to-end visibility and platform extensibility, with machine learning and automation (AIOps), with risk-based alerting, and with Federated Search (i.e., Observability on-demand). (Reference)
Customer success story: As a customer-obsessed bank with ultra-rapid growth, Nubank turned to Splunk to optimize data flows, analytics applications, customer support functions, and insights-obsessed IT monitoring. (Reference)
The key characteristics of the Splunk Observability Cloud are Resilience, Security, Scalability, and EXTENSIBILITY. The latter specifically refers to the ease in which developers can extend Splunk’s capabilities to other apps, applying their AIOps and DevSecOps best practices and principles! Developers can start here.
The Splunk Observability Cloud has many functions for data-intensive IT, Security, and Network operations, including Anomaly Detection Service, Federated Search, Synthetic Monitoring, Incident Intelligence, and much more. Synthetic monitoring is essentially digital twinning of your network and IT environment, providing insights through simulated risks, attacks, and anomalies via predictive and prescriptive modeling. [Reference]
Splunk Observability Cloud’s Federated Search capability activates search and analytics regardless of where your data lives — on-site, in the cloud, or from a third party. (Reference)
The new release of the Splunk Data Manager provides a simple, modern, automated experience of data ingest for Splunk Cloud admins, which reduces the time it takes to configure data collection (from hours/days to minutes). (Reference)
Splunk works on data, data, data, but the focus is always on customer, customer, customer — because delivering best outcomes for customers is job #1. Explore Splunk’s amazing Partner ecosystem (Partnerverse) and the impressive catalog of partners’ solutions here.
In summary, here is my list of key words and topics that illustrate the diverse capabilities and value-packed features of the Splunk Observability Cloud Platform that I learned about at the .conf22 event:
– Anomaly Detection Assistant – Risk-based Alerting (powered by AI and Machine Learning scoring algorithms) – Federated Search (Observability on-demand) – End-to-End Visibility – Platform Extensibility – Massive(!) Scalability of the Splunk Observability Cloud (to billions of transactions per day) – Insights-obsessed Monitoring (“We don’t need more information. We need more insights.”) – APIs in Action (to Turn Data into Doing™) – Splunk Incident Intelligence – Synthetic Monitoring (Digital Twin of Network/IT infrastructure) – Splunk Data Manager – The Splunk Partner Universe (Partnerverse)
My closing thought — Cybersecurity is basically Data Analytics: detection, prediction, prescription, and optimizing for unpredictability. This is what Splunk lives for!
Disclaimer: I was compensated as an independent freelance media influencer for my participation at the conference and for this article. The opinions expressed here are entirely my own and do not represent those of Splunk or of any Splunk partners. Any misrepresentations of the products and services mentioned in my statements are entirely my own responsibility. Nothing here should be construed as an offer to sell or as financial advice of any kind. My comments are entirely of a technical nature, focused on the technical capabilities of the items mentioned in the article.
I recently attended (virtually) CX Summit 2021, presented by Five9, which focused on “CX Reimagined.” At first this title for the event seemed a bit grandiose to me – Reimagined! After attending the event, I now think the title was perfect, and it could have gone even further. I saw how the “art of the possible” in CX (Customer Experience) and EX (Employee Experience) in the Contact Center is already being realized and is being taken to new realms of possibility through AI and Cloud empowerments.
The evolved (reimagined) Contact Center now comes with more options for digital channels to accommodate the customer, more voice data-powered services that serve both the customer and the contact center representative, and more seamless actions on both ends of the call line, even for complex inquiries. This is all enabled by the 3 A’s: AI, Automation, and voice Analytics. We have heard it before: “happy employee, happy customer!” That now looks like this: “EX is the new CX.” Boom!
In an information-packed talk from Gartner Analyst Drew Kraus on “Getting Past the Hype in Customer Service”, where he reviewed just how much hype there is in the customer service and support technologies market, it became clear to me that Five9 delivers on the needs, not the hype.
Another informative and data-packed presentation was by Five9 SVP Scott Kolman and COMMfusion analyst Blair Pleasant, where they presented and did a deep dive into the Five9 survey “2021 Customer Service Index – Learn how customers have reimagined the customer service experience.” I won’t go too deep here (you should watch the whole session on-demand). Some interesting highlights include:
Five9 surveyed 2048 consumers, with participants from 7 countries, representing ages 19 to early 70’s. They also completed a similar survey in 2020. Side-by-side comparisons of the survey results (by age, by year of survey, and by country) for the different survey questions were quite informative and potentially quite useful for any contact center operation. If that’s what you or your business does, then you should investigate these “Voice of the Customer” results.
Across all demographics, only 25% of respondents felt that their contact center experience got worse (either “much worse” or “slightly worse”) from 2020 to 2021. We might have expected a different result with the pandemic raging. Everyone else (75%) felt that their experience got better, much better, or had no opinion.
Some very surprising results appeared (with significant differences between countries) when people were asked to rate the keys to “Good Service Experience”. Highly rated categories were “Rep gets right answer, even if it takes more time” (33%); “Rep can answer my question quickly’’ (26%); and “Don’t have to wait long to reach rep” (20%).
Similarly, there were some significant differences by country when people were asked to rate the keys to “Bad Service Experience”. Top responses included: “Get passed from one rep to another” (34%); “Have to wait long to reach rep” (26%); and a tie for third place (at 13%) for “Cue/on hold system not helpful” and “Rep cannot answer my question quickly”. (Remember, that despite these seriously bad experiences, only 25% of respondents generally saw a drop in customer service experience in the past year.)
One of the more enlightening survey results appeared when asked, “How likely are you to do business with a company if you have a Poor Service Experience?” The USA responses were significantly different than responses from the other 6 countries in the survey in one category: over 11% of USA respondents were “very likely” to continue doing business, versus 3-6% of non-USA respondents being “very likely”. However, in the “somewhat likely” category, all countries were in the range 10-16%, with the USA respondents close to the midpoint, near 14%. In my opinion (not expressed by the session presenters), a reason for these seemingly incompatible responses is that there are two sentiments being conflated in this one question. On the one hand, you have the bad experience on “this” call. On the other hand, you have perhaps the much worse (time-consuming) future experience of switching providers and dealing with the corresponding onboarding (for whatever service this is about). I might be “somewhat likely” to switch providers after one bad call experience, but I would not be “very likely” to go through the pain of switching providers and all that entails.
There were many interesting and powerful sessions in addition to this one, which I focused on here because it presented lots of survey data, and I love data! Another great session was the presentation by former astronaut (now Professor) Michael Massimino – brilliant and inspiring, with numerous words of wisdom, leadership advice, and life’s lessons learned. Of course, I admit that I was drawn into his NASA space stories, including the Hubble Telescope repair mission that almost went wrong, because I worked with the Hubble Space Telescope project for 10 years and I worked an additional 10 years at NASA’s Goddard Space Flight Center where many of the telescope’s instruments were tested.
My big takeaway from the Five9 CX Summit is how cloud, AI, automation, and voice analytics are rapidly driving change in the positive direction for contact center representatives and for customers who call in. Maybe that’s why the customer experience didn’t change much from 2020 to 2021, because a lot of those technologies have already been deployed in the past couple of years, particularly for Five9’s clients.
Chatbots and conversational AI are just part of the story – there’s so much more. Five9’s new cloud-enabled, AI-powered, voice data-driven solutions and services described at the summit are definitely worth exploring and investigating for your contact center: IVA (Intelligent Virtual Agents), VoiceStream, Agent Assist, Studio7, Practical AI, WFO (Work Flow Optimization), Conversation Architect, and UC (unified communications) integration into the contact center VX (Voice Experience) workflow.
Learn more about CX Reimagined and the roles of AI, Automation, Cloud, Voice Analytics, and Omnichannel Customer Engagement in the modern contact center at CX Summit 2021, presented by Five9. (Even if you missed the live event, the sessions are recorded, so you can watch them on-demand at any time you wish.) See for yourself where the Reimagined becomes the Realized in CX. And learn why EX is the new CX.
Note: This article was sponsored. The opinions expressed here are my own and do not represent the opinions of any other person, company, or entity.
For many years, organizations (mostly consumer-facing) have placed the “voice of the customer” (VoC) high on their priority list of top sources for customer intelligence. The goals of such activities are to improve customer service, customer interactions, customer engagement, and customer experience (CX) through just-in-time customer assistance, personalization, and loyalty-building activities. In recent years, even government agencies have increased their attention on Citizen Experience (CX) and Voice of the Citizen (VoC), to inform and guide their citizen services.
CX has become increasingly data-informed and data-driven, with VoC data being one of the key data sources. Other data sources include purchase patterns, online reviews, online shopping behavior analytics, and call center analytics. As good as these data analytics have been, collecting data and then performing pattern-detection and pattern-recognition analytics can be taken so much further now with AI-enabled customer interactions.
AI is great for pattern recognition, product and service recommendations, anomaly detection, next-best action and next-best decision recommendations, and providing an insights power-boost to all of those. AI can be considered as Accelerated, Actionable, Amplified, Assisted, Augmented, even Awesome Intelligence, both for the customer and for the call center staff.
Consequently, VoC and AI have wonderfully come together in conversational AI applications, including chatbots. Chatbots can be deployed to answer FAQs, to direct calls to the right service representative, to detect customer sentiment, to monitor call center employee performance, to recall and recognize patterns in the customer’s prior history with the business, to confirm customer identity, to identify up-sell and cross-sell opportunities, to streamline data entry by automatically capturing intricate details of a customer’s preferences, concerns, requests, critical information, and callback expectations, and to detect when it’s time to direct the call to a human agent (the right human agent).
In short, the VoC reaches its peak value when it captures the full depth and breadth of what the customer is talking about and what they are trying to communicate. AI-enabled chatbots are thus bringing great value and effectiveness in consumers’ call center experiences.
From the call center representative perspective, AI-enabled chatbots are a tremendous efficiency and effectiveness boost for these persons also. Many details of the initial customer interaction can be automatically captured, recorded, indexed, and made searchable even before the call is directed to the representative, increasing the likelihood that it is the right representative for that customer’s specific needs. Not only is the CX amplified, but so is the EX (Employee Experience). Surveys and reports have documented that the strong improvement in call center staff EX is a source of significant value to the entire organization.
One dimension of this EX amplification that should not be overlooked is when advanced case management is required from a human call center agent. In cases like that, the agent is engaged in their best (most satisfying) capacity as the expert and most knowledgeable source to help the customer, in sharp contrast to other calls where they are engaged in answering the standard FAQs, or in quoting customer account information from a database that a chatbot could easily have retrieved, or in asking the customer to repeat the same information that the customer gave to a previous agent. Everybody wins when all those latter activities are handled swiftly, accurately, and non-redundantly prior to the person-to-person engagement that can then provide the best human touch in the entire caller experience.
Chatbots employ a suite of data-driven technologies, including: machine learning (for pattern detection and recognition, sentiment and emotion detection), natural language processing (covering natural language understanding NLU and natural language generation NLG), voice assistants (for voice search and autonomous action-enablement), cloud computing (to activate actions, services, document creation and document processing), AI (for auto-transcribing conversations, creating real-time action lists, and adding information to appropriate fields automatically), and more.
When the Voice of the Customer talks, the modern AI-powered Call Center listens and responds.
Learn more about the modern Call Center and CX Reimagined at CX Summit 2021, presented by Five9. The Summit’s 5 tracks and multiple sessions will focus on the transformation of the contact center through the evolution of digital channels, AI, Automation and Analytics. By applying the power of data and the cloud we can reimagine CX and realize results in a rapidly changing marketplace. At the Summit, you can connect and network with contact center professionals, ecosystem partners and peers, you can learn to optimize your Five9 implementation to superpower your contact center, you can hear customer stories and product updates, and you can learn how Five9 can help you deliver a whole new level of customer service. Register here for CX Summit 2021 and see for yourself where the Reimagined becomes the Realized in CX: https://five9cxsummit.com/insix
Learn more about the Summit, some highlights and key takeaways, in my follow-up article “EX is the New CX.”
Note: This article was sponsored. The opinions expressed here are my own and do not represent the opinions of any other person, company, or entity.
In this post, we will examine ways that your organization can separate useful content into separate categories that amplify your own staff’s performance. Before we start, I have a few questions for you.
What
attributes of your organization’s strategies can you attribute to successful
outcomes? How long do you deliberate before taking specific deliberate actions?
Do you converse with your employees about decisions that might be the converse
of what they would expect? Is a process modification that saves a minute in
someone’s workday considered too minute for consideration? Do you present your
employees with a present for their innovative ideas? Do you perfect your plans
in anticipation of perfect outcomes? Or do you project foregone conclusions on
a project before it is completed?
If
you have good answers to these questions, that is awesome! I would not contest
any of your answers since this is not a contest. In fact, this is actually
something quite different. Before you combine all these questions in a heap and
thresh them in a combine, and before you buffet me with a buffet of skeptical
remarks, stick with me and let me explain. Do not close the door on me when I
am so close to giving you an explanation.
What
you have just experienced is a plethora of heteronyms. Heteronyms are words
that are spelled identically but have different meanings when pronounced
differently. If you include the title of this blog, you were just presented
with 13 examples of heteronyms in the preceding paragraphs. Can you find them
all?
Seriously
now, what do these word games have to do with content strategy? I would say
that they have a great deal to do with it. Specifically, in the modern era of
massive data collections and exploding content repositories, we can no longer
simply rely on keyword searches to be sufficient. In the case of a heteronym, a
keyword search would return both uses of the word, even though their meanings
are quite different. In “information retrieval” language, we would say that we
have high RECALL, but low PRECISION. In other words, we can find most occurrences
of the word (recall), but not all the results correspond to the meaning of our
search (precision). That is no longer good enough when the volume is so high.
The
key to success is to start enhancing and augmenting content management systems
(CMS) with additional features: semantic content and context. This is
accomplished through tags, annotations, and metadata (TAM). TAM management,
like content management, begins with business strategy.
Strategic content management focusses on business outcomes, business process improvement, efficiency (precision – i.e., “did I find only the content that I need without a lot of noise?”), and effectiveness (recall – i.e., “did I find all the content that I need?”). Just because people can request a needle in the haystack, it is not a good thing to deliver the whole haystack that contains that needle. Clearly, such a content delivery system is not good for business productivity. So, there must be a strategy regarding who, what, when, where, why, and how is the organization’s content to be indexed, stored, accessed, delivered, used, and documented. The content strategy should emulate a digital library strategy. Labeling, indexing, ease of discovery, and ease of access are essential if end-users are to find and benefit from the collection.
My favorite approach to TAM creation and to modern data management in general is AI and machine learning (ML). That is, use AI and machine learning techniques on digital content (databases, documents, images, videos, press releases, forms, web content, social network posts, etc.) to infer topics, trends, sentiment, context, content, named entity identification, numerical content extraction (including the units on those numbers), and negations. Do not forget the negations. A document that states “this form should not be used for XYZ” is exactly the opposite of a document that states “this form must be used for XYZ”. Similarly, a social media post that states “Yes. I believe that this product is good” is quite different from a post that states “Yeah, sure. I believe that this product is good. LOL.”
Contextual TAM enhances a CMS with knowledge-driven search and retrieval, not just keyword-driven. Contextual TAM includes semantic TAM, taxonomic indexing, and even usage-based tags (digital breadcrumbs of the users of specific pieces of content, including the key words and phrases that people used to describe the content in their own reports). Adding these to your organization’s content makes the CMS semantically searchable and usable. That’s far more laser-focused (high-precision) than keyword search.
One
type of implementation of a content strategy that is specific to data
collections are data catalogs. Data catalogs are very useful and important.
They become even more useful and valuable if they include granular search
capabilities. For example, the end-user may only need the piece of the dataset
that has the content that their task requires, versus being delivered the full
dataset. Tagging and annotating those subcomponents and subsets (i.e.,
granules) of the data collection for fast search, access, and retrieval is also
important for efficient orchestration and delivery of the data that fuels AI,
automation, and machine learning operations.
One
way to describe this is “smart content” for intelligent digital business
operations. Smart content includes labeled (tagged, annotated) metadata (TAM).
These labels include content, context, uses, sources, and characterizations
(patterns, features) associated with the whole content and with individual
content granules. Labels can be learned through machine learning, or applied by
human experts, or proposed by non-experts when those labels represent cognitive
human-discovered patterns and features in the data. Labels can be learned and
applied in existing CMS, in massive streaming data, and in sensor data
(collected in devices at the “edge”).
Some specific tools and techniques that can be applied to CMS to generate smart content include these:
Natural language understanding and natural language generation
Topic modeling (including topic drift and topic emergence detection)
Consequently, smart content thrives at the convergence of AI and content. Labels are curated and stored with the content, thus enabling curation, cataloguing (indexing), search, delivery, orchestration, and use of content and data in AI applications, including knowledge-driven decision-making and autonomous operations. Techniques that both enable (contribute to) and benefit from smart content are content discovery, machine learning, knowledge graphs, semantic linked data, semantic data integration, knowledge discovery, and knowledge management. Smart content thus meets the needs for digital business operations and autonomous (AI and intelligent automation) activities, which must devour streams of content and data – not just any content, but smart content – the right (semantically identified) content delivered at the right time in the right context.
The
four tactical steps in a smart content strategy include:
Characterize and contextualize the patterns, events, and entities in the content collection with semantic (contextual) tags, annotation, and metadata (TAM).
Collect, curate, and catalog (i.e., index) each TAM component to make it searchable, accessible, and reusable.
Deliver the right content at the right time in the right context to the decision agent.
Decide and act on the delivered insights and knowledge.
Remember,
do not be content with your current content management strategy. But discover
and deliver the perfect smart content that perfects your digital business outcomes.
Smart content strategy can save end-users countless minutes in a typical
workday, and that type of business process improvement certainly is not too
minute for consideration.