Category Archives: Internet of Things

Smart Cities at the Nexus of Emerging Data Technologies and You

One of the most significant characteristics of the evolving digital age is the convergence of technologies. That includes information management (databases), data collection (big data), data storage (cloud), data applications (analytics), knowledge discovery (data science), algorithms (machine learning), transparency (open data), computation (distributed computing: e.g., Hadoop), sensors (internet of things: IoT), and API services (microservices, containerization). One more dimension in this pantheon of tech, which is the most important, is the human dimension. We see the human interaction with technology explicitly among the latest developments in digital marketing, behavioral analytics, user experience, customer experience, design thinking, cognitive computing, social analytics, and (last, but not least) citizen science.

Citizen Scientists are trained volunteers who work on authentic science projects with scientific researchers to answer real-world questions and to address real-world challenges (see discussion here). Citizen Science projects are popular in astronomy, medicine, botany, ecology, ocean science, meteorology, zoology, digital humanities, history, and much more. Check out (and participate) in the wonderful universe of projects at the Zooniverse (zooniverse.org) and at scistarter.com.

In the data science community, we have seen activities and projects that are similar to citizen science in that volunteers step forward to use their skills and knowledge to solve real-world problems and to address real-world challenges. Examples of this include Kaggle.com machine learning competitions and the Data Science Bowl (sponsored each year since 2014 by Booz Allen Hamilton, and hosted by Kaggle). These “citizen science” projects are not just for citizens who are untrained in scientific disciplines, but they are dominated by professional and/or deeply skilled data scientists, who volunteer their time and talents to help solve hard data challenges.

The convergence of data technologies is leading to the development of numerous “smart paradigms”, including smart highways, smart farms, smart grid, and smart cities, just to name a few. By combining this technology convergence (data science, IoT, sensors, services, open data) with a difficult societal challenge (air quality in urban areas) in conjunction with community engagement (volunteer citizen scientists, whether professional or non-professional), the U.S. Environmental Protection Agency (EPA) has knitted the complex fabric of smart people, smart technologies, and smart problems into a significant open competition: the EPA Smart City Air Challenge.

The EPA Smart City Air Challenge launched on August 30, 2016. The challenge is open for about 8 weeks. This is an unusually important and rare project that sits at that nexus of IoT, Big Data Analytics, and Citizen Science. It calls upon clever design thinking at the intersection of sensor technologies, open data, data science, environment science, and social good.

Open data is fast becoming a standard for public institutions, encouraging partnerships between governments and their constituents. The EPA Smart City Air Challenge is a great positive step in that direction. By bringing together expertise across a variety of domains, we can hope to address and fix some hard social, environmental, energy, transportation, and sustainability challenges facing the current age. The challenge competition will bring forward best practices for managing big data at the community level. The challenge encourages communities to deploy hundreds of air quality sensors and to make their data public. The resulting data sets will help communities to understand real-time environmental quality, what are the driving factors in air quality change (including geographic features, urban features, and human factors), to assess which changes will lead to better outcomes (including social, mobile, transportation, energy use, education, human health, etc.), and to motivate those changes at the grass roots local community level.

The EPA Smart City Air Challenge encourages local governments to form partnerships with sensor manufacturers, data management companies, citizen scientists, data scientists, and others. Together they’ll create strategies for collecting and using the data. EPA will award prizes of up to $40,000 to two communities based on their strategies, including their plans to share their data management methods so others can benefit. The prizes are intended to be seed money, so the partnerships are essential.

After receiving awards for their partnerships, strategies and designs, the two winning communities will have a year to start developing and implementing their solutions based on those winning designs. After that year, EPA will then evaluate the accomplishments and collaboration of the two winning communities. Based upon that evaluation, EPA may then award up to an additional $10,000 to each of the two winning communities.

The EPA Smart City Air Challenge is open until October 28, 2016. The competition is for developers and scientists, for data lovers and technology lovers, for startups and for established organizations, for society and for you. Join the competition now! For more information, visit the Smart City Air Challenge website at http://www.challenge.gov/challenge/smart-city-air-challenge/, or write to smartcityairchallenge@epa.gov.

Spread the word about EPA’s Smart City Air Challenge — big data, data science, and IoT for societal good in your communities!

Thanks to Ethan McMahon @mcmahoneth for his contributions to this article and to the EPA Smart City Air Challenge.

Follow Kirk Borne on Twitter @KirkDBorne

Why Today’s Big Data is Not Yesterday’s Big Data — Exponential and Combinatorial Growth

(The following article was first published in July of 2013 at analyticbridge.com. At least 3 of the links in the original article are now obsolete and/or broken. I re-post the article here with the correct links. A lot of things in the Big Data, Data Science, and IoT universe have changed dramatically since that first publication, but I did not edit the article accordingly, in order to preserve the original flavor and context. The central message is still worth repeating today.)

The on-going Big Data media hype stirs up a lot of passionate voices. There are naysayers (“it is nothing new“), doomsayers (“it will disrupt everything”), and soothsayers (e.g., Predictive Analytics experts). The naysayers are most bothersome, in my humble opinion. (Note: I am not talking about skeptics, whom we definitely and desperately need during any period of maximized hype!)

We frequently encounter statements of the “naysayer” variety that tell us that even the ancient Romans had big data.  Okay, I understand that such statements logically follow from one of the standard definitions of big data: data sets that are larger, more complex, and generated more rapidly than your current resources (computational, data management, analytic, and/or human) can handle — whose characteristics correspond to the 3 V’s of Big Data.  This definition of Big Data could be used to describe my first discoveries in a dictionary or my first encounters with an encyclopedia.  But those “data sets” are hardly “Big Data” — they are universally accessible, easily searchable, and completely “manageable” by their handlers. Therefore, they are SMALL DATA, and thus it is a myth to label them as “Big Data”. By contrast, we cannot ignore the overwhelming fact that in today’s real Big Data tsunami, each one of us generates insurmountable collections of data on our own. In addition, the correlations, associations, and links between each person’s digital footprint and all other persons’ digital footprints correspond to an exponential (actually, combinatorial) explosion in additional data products.

Nevertheless, despite all of these clear signs that today’s big data environment is something radically new, that doesn’t stop the naysayers.  With the above standard definition of big data in their quiver, the naysayers are fond of shooting arrows through all of the discussions that would otherwise suggest that big data are changing society, business, science, media, government, retail, medicine, cyber-anything, etc. I believe that this naysayer type of conversation is unproductive, unhelpful, and unscientific. The volume, complexity, and speed of data today are vastly different from anything that we have ever previously experienced, and those facts will be even more emphatic next year, and even more so the following year, and so on.  In every sector of life, business, and government, the data sets are becoming increasingly off-scale and exponentially unmanageable. The 2011 McKinsey report Big Data: The Next Frontier for Innovation, Competition, and Productivity.” made this abundantly clear.  When the Internet of Things and machine-to-machine applications really become established, then the big data V’s of today will seem like child’s play.

In an attempt to illustrate the enormity of scale of today’s (and tomorrow’s) big data, I have discussed the exponential explosion of data in my TedX talk Big Data, small world (e.g., you can fast-forward to my comments on this topic starting approximately at the 9:00 minute mark in the video). You can also read more about this topic in the article Big Data Growth – Compound Interest on Steroids“, where I have elaborated on the compound growth rate of big data — the numbers will blow your mind, and they should blow away the naysayers’ arguments.  Read all about it at http://rocketdatascience.org/?p=204.

Follow Kirk Borne on Twitter @KirkDBorne
 

Definitive Guides to Data Science and Analytics Things

The Definitive Guide to anything should be a helpful, informative road map to that topic, including visualizations, lessons learned, best practices, application areas, success stories, suggested reading, and more.  I don’t know if all such “definitive guides” can meet all of those qualifications, but here are some that do a good job:

  1. The Field Guide to Data Science (big data analytics by Booz Allen Hamilton)
  2. The Data Science Capability Handbook (big data analytics by Booz Allen Hamilton)
  3. The Definitive Guide to Becoming a Data Scientist (big data analytics)
  4. The Definitive Guide to Data Science – The Data Science Handbook (analytics)
  5. The Definitive Guide to doing Data Science for Social Good (big data analytics, data4good)
  6. The Definitive Q&A Guide for Aspiring Data Scientists (big data analytics, data science)
  7. The Definitive Guide to Data Literacy for all (analytics, data science)
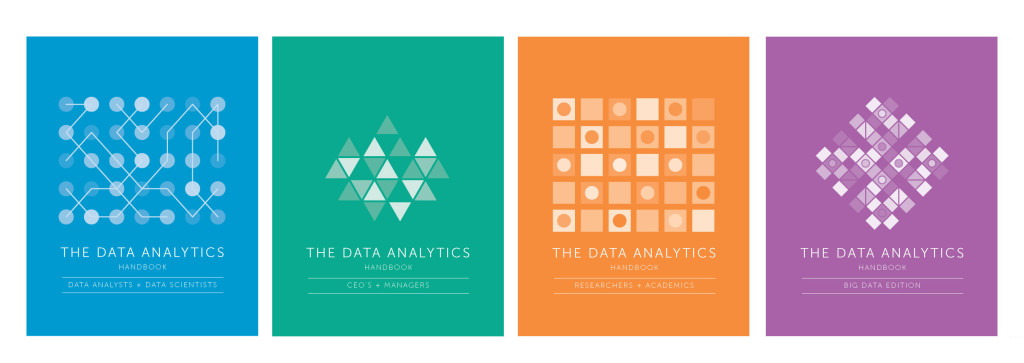
  8. The Data Analytics Handbook Series (big data, data science, data literacy by Leada)
  9. The Big Analytics Book (big data, data science)
  10. The Definitive Guide to Big Data (analytics, data science)
  11. The Definitive Guide to the Data Lake (big data analytics by MapR)
  12. The Definitive Guide to Business Intelligence (big data, business analytics)
  13. The Definitive Guide to Natural Language Processing (text analytics, data science)
  14. A Gentle Guide to Machine Learning (analytics, data science)
  15. Building Machine Learning Systems with Python (a non-definitive guide) (data analytics)
  16. The Definitive Guide to Data Journalism (journalism analytics, data storytelling)
  17. The Definitive “Getting Started with Apache Spark” ebook (big data analytics by MapR)
  18. The Definitive Guide to Getting Started with Apache Spark (big data analytics, data science)
  19. The Definitive Guide to Hadoop (big data analytics)
  20. The Definitive Guide to the Internet of Things for Business (IoT, big data analytics)
  21. The Definitive Guide to Retail Analytics (customer analytics, digital marketing)
  22. The Definitive Guide to Personalization Maturity in Digital Marketing Analytics (by SYNTASA)
  23. The Definitive Guide to Nonprofit Analytics (business intelligence, data mining, big data)
  24. The Definitive Guide to Marketing Metrics & Analytics
  25. The Definitive Guide to Campaign Tagging in Google Analytics (marketing, SEO)
  26. The Definitive Guide to Channels in Google Analytics (SEO)
  27. A Definitive Roadmap to the Future of Analytics (marketing, machine learning)
  28. The Definitive Guide to Data-Driven Attribution (digital marketing, customer analytics)
  29. The Definitive Guide to Content Curation (content-based marketing, SEO analytics)
  30. The Definitive Guide to Collecting and Storing Social Profile Data (social big data analytics)
  31. The Definitive Guide to Data-Driven API Testing (analytics automation, analytics-as-a-service)
  32. The Definitive Guide to the World’s Biggest Data Breaches (visual analytics, privacy analytics)

Follow Kirk Borne on Twitter @KirkDBorne

4_book_image-6fd6043b69f0bb051f45055c9481cccc

Just-in-Time Supply Chain Management with Data Analytics

A common phrase in SCM (Supply Chain Management) is Just-In-Time (JIT) inventory. JIT refers to a management strategy in which raw materials, products, or services are delivered to the right place, at the right time, as demand requires. This has always been an excellent business goal, but the power to excel at JIT inventory management is now improving dramatically with the increased use of data analytics across the supply chain.

In the article “Operational Analytics and Droning About Big Data“, we discussed two examples of JIT: (1) a just-in-time supply replenishment system for human bases on the Moon, and (2) the proposal by Amazon to use drones to deliver products to your front door “just in time”! The Internet of Things will almost certainly generate similar use cases and benefits.

Descriptive analytics (hindsight) tells you what has already happened in your supply chain. If there was a deficiency or problem somewhere, then you can react to that event. But, that is “old school” supply chain management. Modern analytics is predictive (foresight), allowing you to predict where the need will occur (in advance) so that you can proactively deliver products and services at the point of need, just in time.

The next advance in analytics is prescriptive (insight), which uses optimization techniques (from operations research) in combination with insights and knowledge of your business (systems, processes, and resources) in order to optimize your delivery systems, for the best possible outcome (greater sales, fewer losses, reduced inventory, etc.). Just-in-time supply chain management then becomes something more than a reality — it now becomes an enabler of increased efficiency and productivity.

Many more examples of use cases in the manufacturing and retail industries (and elsewhere) where just-in-time analytics is important (and what you can do about it) have been enumerated by the fast Automatic Modeling folks from Soft10, Inc. Check out their fast predictive analytics products at http://soft10ware.com/.

(Read more about these ideas at: https://www.linkedin.com/pulse/supply-chain-data-analytics-jit-legit-kirk-borne)

Follow Kirk Borne on Twitter @KirkDBorne


Variety is the Spice of Life for Data Scientists

“Variety is the spice of life,” they say.  And variety is the spice of data also: adding rich texture and flavor to otherwise dull numbers. Variety ranks among the most exciting, interesting, and challenging aspects of big data.  Variety is one of the original “3 V’s of Big Data” and is frequently mentioned in Big Data discussions, which focus too much attention on Volume.

A short conversation with many “old school technologists” these days too often involves them making the declaration: We’ve always done big data.”  That statement really irks me… for lots of reasons.  I summarize in the following article some of those reasons:  “Today’s Big Data is Not Yesterday’s Big Data.” In a nutshell, those statements focus almost entirely on Volume, which is really missing the whole point of big data (in my humble opinion)… here comes the Internet of Things… hold onto your bits!

The greatest challenges and the most interesting aspects of big data appear in high-Velocity Big Data (requiring fast real-time analytics) and high-Variety Big Data (enabling the discovery of interesting patterns, trends, correlations, and features in high-dimensional spaces). Maybe because of my training as an astrophysicist, or maybe because scientific curiosity is a natural human characteristic, I love exploring features in multi-dimensional parameter spaces for interesting discoveries, and so should you!

Dimension reduction is a critical component of any solution dealing with high-variety (high-dimensional) data. Being able to sift through a mountain of data efficiently in order to find the key predictive, descriptive, and indicative features of the collection is a fundamental required data science capability for coping with Big Data.

Identifying the most interesting dimensions of the data is especially valuable when visualizing high-dimensional data. There is a “good news, bad news” perspective here. First, the bad news: the human capacity for seeing multiple dimensions is very limited: 3 or 4 dimensions are manageable; and 5 or 6 dimensions are possible; but more dimensions are difficult-to-impossible to assimilate. Now for the good news: the human cognitive ability to detect patterns, anomalies, changes, or other “features” in a large complex “scene” surpasses most computer algorithms for speed and effectiveness. In this case, a “scene” refers to any small-n projection of a larger-N parameter space of variables.

In data visualization, a systematic ordered parameter sweep through an ensemble of small-n projections (scenes) is often referred to as a “grand tour”, which allows a human viewer of the visualization sequence to see quickly any patterns or trends or anomalies in the large-N parameter space. Even such “grand tours” can miss salient (explanatory) features of the data, especially when the ratio N/n is large. Consequently, a data analytics approach that combines the best of both worlds (machine vision algorithms and human perception) will enable efficient and effective exploration of large high-dimensional data.

One such approach is to use statistical and machine learning techniques to develop “interestingness metrics” for high-variety data sets.  As such algorithms are applied to the data (in parameter sweeps or grand tours), they can discover and then present to the data end-user the most interesting and informative features (or combinations of features) in high-dimensional data: “Numbers are powerful, especially in interesting combinations.”

The outcomes of such exploratory data analyses are even more enhanced when the analytics tool ranks the output models (e.g., the data’s “most interesting parameters”) in order of significance and explanatory power (i.e., their ability to “explain” the complex high-dimensional patterns in the data).  Soft10’s “automatic statistician” Dr. Mo is a fast predictive analytics software package for exploring complex high-dimensional (high-variety) data.  Dr. Mo’s proprietary modeling and analytics techniques have been applied across many application domains, including medicine and health, finance, customer analytics, target marketing, nonprofits, membership services, and more. Check out Dr. Mo at http://soft10ware.com/ and read more herehttp://soft10ware.com/big-data-complexity-requires-fast-modeling-technology/

Kirk Borne is a member of the Soft10, Inc. Board of Advisors.

Follow Kirk Borne on Twitter @KirkDBorne