When I was out for a walk recently, I heard a loud low-flying aircraft passing overhead. This was not unusual since we live in the flight path of planes landing at a major international airport about 10 miles from our home. In this case, I thought to myself that the sound seemed more directly overhead and lower than normal as well as being suggestive of a larger than average jet aircraft.
I realized that in my one simple thought, I had made three different inferences from a single stream of data. The data stream was the audible sound of the aircraft. The three inferences were about the altitude (lower than normal), the size (larger than average), and the flight path (more overhead). When I looked up, my tri-inference hypothesis was confirmed. The plane was a very large, low-flying jet for a major overnight shipping company. The slightly unusual flight path may have been associated with the fact that these planes are probably instructed to land on a different runway at the airport than the usual commercial passenger airlines’ flights – consequently, the altitude and location were slightly different from the slightly smaller commercial passenger airlines that pass overhead every day.
This situation caused me to reflect on how often we can jump to conclusions, infer a hypothesis, and (maybe without as much proof as in this case) we assume that our conclusion is true.
For the modern digital organization, the proof of any inference (that drives decisions) should be in the data! Rich and diverse data collections enable more accurate and trustworthy conclusions.
I frequently refer to the era of big data as “the end of demographics”. By that, I mean that we now have many more features, attributes, data sources, and insights into each entity in our domain: people, processes, and products. These multiple data sources enable a “360 view” of the entity, thus empowering a more personalized (even hyper-personalized) understanding of and response to the needs of that unique entity. In “big data language”, we are talking about one of the 3 V’s of big data: big data Variety!
High variety is one of the foundational key features of big data — we now measure many more features, characteristics, and dimensions of insight into nearly everything due to the plethora of data sources, sensors, and signals that we measure, monitor, and mine. Consequently, we no longer need to rely on a limited number of features and attributes when making decisions, taking actions, and generating inferences. We can make better, tailored, more personalized decisions and actions. Every entity is unique! That marks the end of demographics.
Here is another example: suppose that a person goes to their doctor to report problems with painful headaches. That is a single symptom (headache pain) — a single data source, a single signal, a single sensor. However, one could imagine a large number of possible inferences from that one single signal. The headaches could be caused by insufficient sleep (sleep apnea), high blood pressure, pregnancy, or a brain tumor. Obviously, each one of these diagnoses carries a seriously different course of action and treatment.
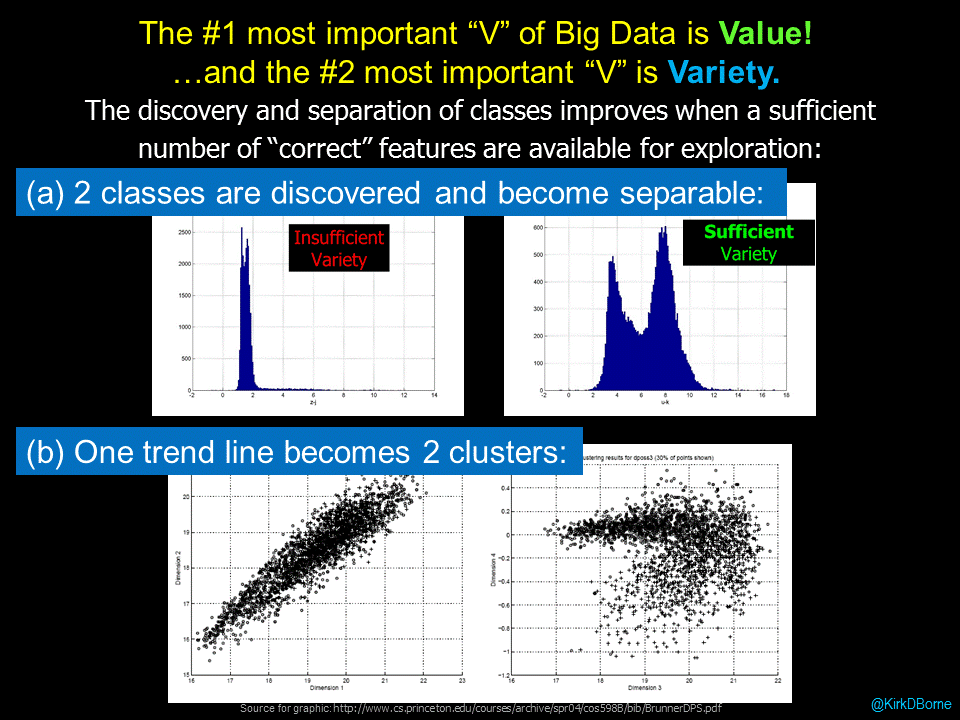
In “data science language”, what we are describing are different segments (clusters) in the hyperspace of symptoms and causes in which the many causes (clusters) are projected on top of one another (overlap one another) in the symptom space. The way that a data scientist resolves that degeneracy (another data science word) is to introduce more parameters (higher variety data) in order to “look at” those overlapping clusters from different angles and perspectives, thus resolving the different diagnosis clusters. High variety data enables the discovery of multiple clusters, and eventually identifies the correct cluster (correct diagnosis, in this case).
Higher variety data means that we are adding data from other sensors, other signals, other sources, and of different types. Going back to our low-flying airplane example, this has the following application: I not only heard the aircraft (sound = audio data), but I also looked at it (sight = visual data) and I observed its flight path (dynamic change over time = time series data). The proof of my inference about the airplane was in the data! Additional data sources provided the variety of data signals that were needed in order to derive a correct conclusion.
Similarly, when you go to the doctor with that headache, the doctor will start asking about other symptoms (e.g., lack of appetite; or other pains) and may order other medical tests (blood pressure checks, or other lab results). Those additional data sources and sensors provide the variety of data signals that are needed in order to derive the correct diagnosis.
These examples (low-flying aircraft, and headache pain) are representative analogies of a large number of different use cases in every organization, every business, and every process. The more data you have, the better you are able to detect and discover interesting and important phenomena and events. However, the more variety of data you have, the better you are able to correctly diagnose, interpret, understand, gain insights from, and take appropriate action in response to those phenomena and events.
High-variety data is the fuel that powers these insights, because variety is definitely the secret sauce for bigger and better discovery from big data collections.
Follow Kirk on Twitter at @KirkDBorne


