Apervi’s Conflux Gives a Big Boost to a Confluence of Big Data Workflows

Data-driven workflows are the life and existence of big data professionals everywhere: data scientists, data analysts, and data engineers. We perform all types of data functions in these workflow processes: archive, discover, access, visualize, mine, manipulate, fuse, integrate, transform, feed models, learn models, validate models, deploy models, etc. It is a dizzying day’s work. We start manually in our workflow development, identifying what needs to happen at each stage of the process, what data are needed, when they are needed, where data needs to be staged, what are the inputs and outputs, and more.  If we are really good, we can improve our efficiency in performing these workflows manually, but not substantially. A better path to success is to employ a workflow platform that is scalable (to larger data), extensible (to more tasks), more efficient (shorter time-to-solution), more effective (better solutions), adaptable (to different user skill levels and to different business requirements), comprehensive (providing a wide scope of functionality), and automated (to break the time barrier of manual workflow activities).

(continue reading here http://www.bigdatanews.com/group/bdn-daily-press-releases/forum/topics/apervi-s-conflux-gives-a-big-boost-to-a-confluence-of-big-data-wo)

Apervi Conflux


Follow Kirk Borne on Twitter @KirkDBorne

Visual Cues in Big Data for Analytics and Discovery

One of the most fun outcomes that you can achieve with your data is to discover new and interesting things.  Sometimes, the most interesting thing is the detection of a novel, unexpected, surprising object, event, or behavior – i.e., the outlier, the thing that falls outside the bounds of your original expectations, the thing that signals something new about your data domain (a new class of behavior, an anomaly in the data processing pipeline, or an error in the data collection activity).  The more quickly that you can find the interesting features and characteristics within your data collection, consequently the more likely you are to improve decision-making and responsiveness in your data-driven workflows.

Tapping into the human natural cognitive ability to see patterns quickly and to detect anomalies readily is powerful medicine for big data analytics headaches.  That’s where data visualization shines most brightly in the big data firmament!

(continue reading here … http://www.bigdatanews.com/group/bdn-daily-press-releases/forum/topics/press-release-visual-cues-in-big-data-for-analytics-and-discovery)


Follow Kirk Borne on Twitter @KirkDBorne

Welcome to Rocket-Powered Data Science

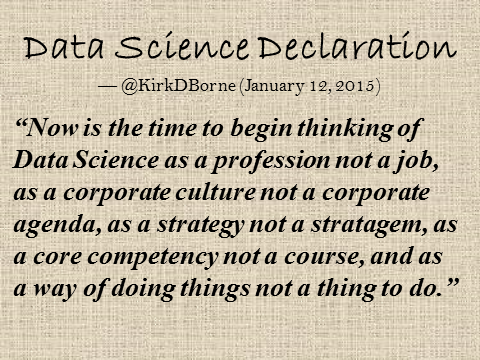
DataScienceDeclaration

Data Science Declaration (by Kirk Borne, January 2015)

Welcome to Rocket-Powered Data Science!  What is rocket-powered data science?  No, it is not about rockets and space travel.  But it is about advanced big data analytics for data-driven ​discovery, decision support, and innovation through data science.  In this context, data science *is* rocket science.  But, this rocket science is accessible to all: experts​ as well as newcomers, big enterprises as well as small businesses, technology power teams as well as individual explorers, and math/statistics wizards as well as lifelong learners at the start of their data science journeys.

In the article “Five Fundamental Concepts of Data Science​“, we listed these principles:

1) Begin with the end in mind.
2) Know your data.
3) Remember that this *is* science.
4) Data are never perfect, but love your data anyway.
5) Overfitting is a sin against data science.

In the case of principle #3, we amend it here to say “Remember that data science is rocket science!”  For best results (provable, reproducible, validated, and verified), we should consistently apply rigorous scientific methodology — the scientific cycle of measurement, inference, hypothesis generation, experimental design, evaluation, hypothesis validation and/or refinement. Therefore, we begin with the end in mind (including requirements gathering and analysis) — this is a basic principle for any system engineering, business program, marketing campaign, scientific experimentation, clinical study, or rocket science project!

Enjoy your visit here.  Check out our blogs (covering the world of data science, data mining, statistics, big data, analytics, data visualization, linked data, and computational modeling); and look for more data science fun as we share our love of data.

#DataLovers-R-us!

Follow Kirk Borne on Twitter @KirkDBorne