Tag Archives: Analytics

Why Today’s Big Data is Not Yesterday’s Big Data — Exponential and Combinatorial Growth

(The following article was first published in July of 2013 at analyticbridge.com. At least 3 of the links in the original article are now obsolete and/or broken. I re-post the article here with the correct links. A lot of things in the Big Data, Data Science, and IoT universe have changed dramatically since that first publication, but I did not edit the article accordingly, in order to preserve the original flavor and context. The central message is still worth repeating today.)

The on-going Big Data media hype stirs up a lot of passionate voices. There are naysayers (“it is nothing new“), doomsayers (“it will disrupt everything”), and soothsayers (e.g., Predictive Analytics experts). The naysayers are most bothersome, in my humble opinion. (Note: I am not talking about skeptics, whom we definitely and desperately need during any period of maximized hype!)

We frequently encounter statements of the “naysayer” variety that tell us that even the ancient Romans had big data.  Okay, I understand that such statements logically follow from one of the standard definitions of big data: data sets that are larger, more complex, and generated more rapidly than your current resources (computational, data management, analytic, and/or human) can handle — whose characteristics correspond to the 3 V’s of Big Data.  This definition of Big Data could be used to describe my first discoveries in a dictionary or my first encounters with an encyclopedia.  But those “data sets” are hardly “Big Data” — they are universally accessible, easily searchable, and completely “manageable” by their handlers. Therefore, they are SMALL DATA, and thus it is a myth to label them as “Big Data”. By contrast, we cannot ignore the overwhelming fact that in today’s real Big Data tsunami, each one of us generates insurmountable collections of data on our own. In addition, the correlations, associations, and links between each person’s digital footprint and all other persons’ digital footprints correspond to an exponential (actually, combinatorial) explosion in additional data products.

Nevertheless, despite all of these clear signs that today’s big data environment is something radically new, that doesn’t stop the naysayers.  With the above standard definition of big data in their quiver, the naysayers are fond of shooting arrows through all of the discussions that would otherwise suggest that big data are changing society, business, science, media, government, retail, medicine, cyber-anything, etc. I believe that this naysayer type of conversation is unproductive, unhelpful, and unscientific. The volume, complexity, and speed of data today are vastly different from anything that we have ever previously experienced, and those facts will be even more emphatic next year, and even more so the following year, and so on.  In every sector of life, business, and government, the data sets are becoming increasingly off-scale and exponentially unmanageable. The 2011 McKinsey report Big Data: The Next Frontier for Innovation, Competition, and Productivity.” made this abundantly clear.  When the Internet of Things and machine-to-machine applications really become established, then the big data V’s of today will seem like child’s play.

In an attempt to illustrate the enormity of scale of today’s (and tomorrow’s) big data, I have discussed the exponential explosion of data in my TedX talk Big Data, small world (e.g., you can fast-forward to my comments on this topic starting approximately at the 9:00 minute mark in the video). You can also read more about this topic in the article Big Data Growth – Compound Interest on Steroids“, where I have elaborated on the compound growth rate of big data — the numbers will blow your mind, and they should blow away the naysayers’ arguments.  Read all about it at http://rocketdatascience.org/?p=204.

Follow Kirk Borne on Twitter @KirkDBorne


The Definitive Q&A Guide for Aspiring Data Scientists

I was asked five questions by Alex Woodie of Datanami for his article, “So You Want To Be A Data Scientist”. He used a few snippets from my full set of answers. The longer version of my answers provided additional advice. For aspiring data scientists of all ages, I provide in my article at MapR the full, unabridged version of my answers, which may help you even more to achieve your goal.  Here are Alex’s questions. (Note: I paraphrase the original questions in quotes below.)

1. “What is the number one piece of advice you give to aspiring data scientists?”

2. “What are the most important skills for an aspiring data scientist to acquire?”

3. “Is it better for a person to stay in school and enroll in a graduate program, or is it better to acquire the skills on-the-job?”

4. “For someone who stays in school, do you recommend that they enroll in a program tailored toward data science, or would they get the requisite skills in a ‘hard science’ program such as astrophysics (like you)?”

5. “Do you see advances in analytic packages replacing the need for some of the skills that data scientists have traditionally had, such as programming skills (Python, Java, etc.)?”

Find all of my answers at “The Definitive Q&A for Aspiring Data Scientists“.

Follow Kirk Borne on Twitter @KirkDBorne
Definitive Guides to Data Science and Analytics Things

The Definitive Guide to anything should be a helpful, informative road map to that topic, including visualizations, lessons learned, best practices, application areas, success stories, suggested reading, and more.  I don’t know if all such “definitive guides” can meet all of those qualifications, but here are some that do a good job:

  1. The Field Guide to Data Science (big data analytics by Booz Allen Hamilton)
  2. The Data Science Capability Handbook (big data analytics by Booz Allen Hamilton)
  3. The Definitive Guide to Becoming a Data Scientist (big data analytics)
  4. The Definitive Guide to Data Science – The Data Science Handbook (analytics)
  5. The Definitive Guide to doing Data Science for Social Good (big data analytics, data4good)
  6. The Definitive Q&A Guide for Aspiring Data Scientists (big data analytics, data science)
  7. The Definitive Guide to Data Literacy for all (analytics, data science)
  8. The Data Analytics Handbook Series (big data, data science, data literacy by Leada)
  9. The Big Analytics Book (big data, data science)
  10. The Definitive Guide to Big Data (analytics, data science)
  11. The Definitive Guide to the Data Lake (big data analytics by MapR)
  12. The Definitive Guide to Business Intelligence (big data, business analytics)
  13. The Definitive Guide to Natural Language Processing (text analytics, data science)
  14. A Gentle Guide to Machine Learning (analytics, data science)
  15. Building Machine Learning Systems with Python (a non-definitive guide) (data analytics)
  16. The Definitive Guide to Data Journalism (journalism analytics, data storytelling)
  17. The Definitive “Getting Started with Apache Spark” ebook (big data analytics by MapR)
  18. The Definitive Guide to Getting Started with Apache Spark (big data analytics, data science)
  19. The Definitive Guide to Hadoop (big data analytics)
  20. The Definitive Guide to the Internet of Things for Business (IoT, big data analytics)
  21. The Definitive Guide to Retail Analytics (customer analytics, digital marketing)
  22. The Definitive Guide to Personalization Maturity in Digital Marketing Analytics (by SYNTASA)
  23. The Definitive Guide to Nonprofit Analytics (business intelligence, data mining, big data)
  24. The Definitive Guide to Marketing Metrics & Analytics
  25. The Definitive Guide to Campaign Tagging in Google Analytics (marketing, SEO)
  26. The Definitive Guide to Channels in Google Analytics (SEO)
  27. A Definitive Roadmap to the Future of Analytics (marketing, machine learning)
  28. The Definitive Guide to Data-Driven Attribution (digital marketing, customer analytics)
  29. The Definitive Guide to Content Curation (content-based marketing, SEO analytics)
  30. The Definitive Guide to Collecting and Storing Social Profile Data (social big data analytics)
  31. The Definitive Guide to Data-Driven API Testing (analytics automation, analytics-as-a-service)
  32. The Definitive Guide to the World’s Biggest Data Breaches (visual analytics, privacy analytics)

Follow Kirk Borne on Twitter @KirkDBorne
4_book_image-6fd6043b69f0bb051f45055c9481cccc

Outliers, Inliers, and Other Surprises that Fly from your Data

Data can fly beyond the bounds of our models and our expectations in surprising and interesting ways. When data fly in these ways, we often find new insights and new value about the people, products, and processes that our data sources are tracking. Here are 4 simple examples of surprises that can fly from our data:

(1) Outliers — when data points are several standard deviations from the mean of your data distribution, these are traditional data outliers. These may signal at least 3 possible causes: (a) a data measurement problem (in the sensor); (b) a data processing problem (in the data pipeline); or (c) an amazing unexpected discovery about your data items. The first two causes are data quality issues that must be addressed and repaired. The latter case (when your data fly outside the bounds of your expectations) is golden and worthy of deeper exploration.

(2) Inliers — sometimes your data have constraints (business rules) that are inviolable (e.g., Fraction of customers that are Male + Fraction of customers that are Female = 1). A simple business example would be: Profit = Revenue minus Costs. Suppose an analyst examines these 3 numbers (Profit, Revenue, Costs) for many different entries in his business database, and he finds a data entry that is near the mean of the distribution for each of those 3 numbers. It appears (at first glance) that this entry is perfectly normal (an inlier, not an outlier), but in fact it might violate the above business rule. In that case, there is definitely a problem with these numbers — they have “flown” outside the bounds of the business rule.

(3) Nonlinear correlations — fitting a curve y=F(x) through data for the purpose of estimating values of y for new values of x is called regression. This is also an example of Predictive Analytics (we can predict future values based upon a function that was learned from the historical training data). When using higher-order functions for F(x) (especially polynomial functions), we must remember that the curves often diverge (to extreme values) beyond the range of the known data points that were used to learn the function. Such an extrapolation of the regression curve could lead to predictive outcomes that make no sense, because they fly far beyond reasonable values of our data parameters.

(4) Uplift — when two events occur together more frequently than you would expect from random chance, then their mutual dependence causes uplift. Statistical lift is simply measured by: P(X,Y)/[P(X)P(Y)]. The numerator P(X,Y) represents the joint frequency of two events X and Y co-occurring simultaneously. The denominator represents the probability that the two events X and Y will co-occur (at the same time) at random. If X and Y are completely independent events, then the numerator will equal the denominator – in that case (mutual independence), the uplift equals 1 (i.e., no lift). Conversely, if there is a higher than random co-occurrence of X and Y, then the statistical lift flies to values that are greater than 1 — that’s uplift! And that’s interesting. Cases with significant uplift can be marketing gold for your organization: in customer recommendation engines, in fraud detection, in targeted marketing campaigns, in community detection within social networks, or in mining electronic health records for adverse drug interactions and side effects.

These and other such instances of high-flying data are increasingly challenging to identify in the era of big data: high volume and high variety produce big computational challenges in searching for data that fly in interesting directions (especially in complex high-dimensional data sets). To achieve efficient and effective discovery in these cases, fast automatic statistical modeling can help. For this purpose, I recommend that you check out the analytics solutions from the fast automatic modeling folks at http://soft10ware.com/.

The Soft10 software package is trained to report automatically the most significant, informative and interesting dependencies in your data, no matter which way the data fly.

(Read the full blog, with more details for the 4 cases listed above, at: https://www.linkedin.com/pulse/when-data-fly-kirk-borne)

Follow Kirk Borne on Twitter @KirkDBorne

Reach Analytics Maturity through Fast Automatic Modeling

The late great baseball legend Yogi Berra was credited with saying this gem: “The future ain’t what it used to be.” In the context of big data analytics, I am now inclined to believe that Yogi was very insightful — his statement is an excellent description of Prescriptive Analytics.

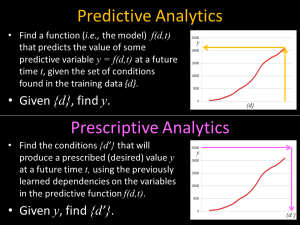
Prescriptive Analytics goes beyond Descriptive and Predictive Analytics in the maturity framework of analytics. “Descriptive” analytics delivers hindsight (telling you what did happen, by generating reports from your databases), and “predictive” delivers foresight (telling you what will happen, through machine learning algorithms). Going one better, “prescriptive” delivers insight: discovering so much about your application domain (from your collection of big data and information resources, through data science and predictive models) that you are now able to take the actions (e.g., set the conditions and parameters) needed to achieve a prescribed (better, optimal, desired) outcome.

So, if predictive analytics can use historical training data sets to tell us what will happen in the future (e.g., which products a customer will buy; where and when your supply chain will need replenishing; which vehicles in your corporate fleet will need repairs; which machines in your manufacturing plant will need maintenance; or which servers in your data center will fail), then prescriptive analytics can alter that future (i.e., the future ain’t what it used to be).

When dealing with large high-variety data sets, with many features and measured attributes, it is often difficult to build accurate models that are generally useful under a variety of conditions and that capture all of the complexities of the response functions and explanatory variables within your business application. In such cases, fast automatic modeling tools are needed. These tools can help to identify the minimum viable feature set for accurate predictive and prescriptive modeling. For this purpose, I recommend that you check out the analytics solutions from the fast automatic modeling folks at http://soft10ware.com/.

The Soft10 software package is trained to observe quickly and report automatically the most significant, informative and explanatory dependencies in your data. Those capabilities are the “secret sauce” in insightful prescriptive analytics, and they coincide nicely with another insightful quote from Yogi Berra: “You can observe a lot by just watching.”

(Read the full blog at: https://www.linkedin.com/pulse/prescriptive-analytics-future-aint-what-used-kirk-borne)

Predictive versus Prescriptive Analytics

Predictive Analytics (given X, find Y) vs. Prescriptive Analytics (given Y, find X)

Follow Kirk Borne on Twitter @KirkDBorne

Fraud Analytics: Fast Automatic Modeling for Customer Loyalty Programs

It doesn’t take a rocket scientist to understand the deep and dark connection between big money and big fraud. One need only look at black markets for drugs and other controlled and/or precious commodities. But what about cases where the commodity is soft, intangible, and practically virtual? I am talking about loyalty and rewards programs.

A study by Colloquy (in 2011) estimated that the loyalty and rewards programs in the U.S. alone had an estimated outstanding value of $48 billion US dollars. This is “outstanding” value because it doesn’t carry tangible benefit until the rewards or loyalty points are cashed in, redeemed, or otherwise exchanged for something that you can “take to the bank”. In anybody’s book, $48 billion is really big value — i.e., big money rewards for loyal customers, and a big target for criminals seeking to defraud the rightful beneficiaries of these rewards.

The risk vs. reward equation in loyalty programs now has huge numbers on both sides of that equation. There’s great value for customers. There’s great return on investment for businesses seeking loyal customers. And that’s great bait to lure criminals into the game.

In the modern digital marketplace, it is now possible to manipulate payment systems on a larger scale, thereby defrauding the business of thousands of dollars in rewards points. The scale of the fraud could match the scale of the entire loyalty program for some firms, which would therefore bankrupt their supply of rewards for their loyal and faithful customers. This is a really big problem waiting to happen unless something is done about it.

The something that can be done about it is to take advantage of the fast predictive modeling capabilities for fraud detection that are enabled by access to more data (big data), better technology (analytics tools), and more insightful predictive and prescriptive algorithms (data science).

Fraud analytics is no silver bullet. It won’t rid the world of fraudsters and other criminals. But at least fast automatic modeling will give firms better defenses, more timely alerts, and faster response capabilities. This is essential because, in the digital era, it is not only business that is moving at the speed of light, but so also are the business disruptors.

Some simple use cases for fraud analytics within the context of customer loyalty reward programs can be found in the article “Where There’s Big Money, There’s Big Fraud (Analytics)“.

Payment fraud reaches across a vast array of industries: insurance (of all kinds), underwriting, social programs, purchasing and procurement, and now loyalty and rewards programs. Be prepared. Check out the analytics solutions from the fast automatic modeling folks at http://soft10ware.com/.

Follow Kirk Borne on Twitter @KirkDBorne


Open Data: Big Benefits, 7 V’s, and Thousands of Repositories

Open data repositories are fantastic for many reasons, including: (1) they provide a source of insight and transparency into the domains and organizations that are represented by the data sets; (2) they enable value creation across a variety of domains, using the data as the “fuel” for innovation, government transformation, new ideas, and new businesses; (3) they offer a rich variety of data sets for data scientists to sharpen their data mining, knowledge discovery, and machine learning modeling skills; (4) they allow many more eyes to look at the data and thereby to see things that might have been missed by the creators and original users of the data; and (5) they enable numerous “data for social good” activities (hackathons, citizen-focused innovations, public development efforts, and more).

Some of the key players in efforts that use open data for social good include: DataKind, Bayes ImpactBooz-Allen Hamilton, Kaggle, Data Analysts for Social Good, and the Tableau Foundation. Check out this “Definitive Guide to do Data Science for Good.” Interested scientists should also check out the Data Science for Social Good Fellowship Program.

We have discussed 6 V’s of Open Data at the DATA Act Forum in July 2015.  We have now added more. The following seven V’s represent characteristics and challenges of open data:

  1. Validity:  data quality, proper documentation, and data usefulness are always an imperative, but it is even more critical to pay attention to these data validity concerns when your organization’s data are exposed to scrutiny and inspection by others.
  2. Value:  new ideas, new businesses, and innovations can arise from the insights and trends that are found in open data, thereby creating new value both internal and external to the organization.
  3. Variety:  the number of data types, formats, and schema are as varied as the number of organizations who collect data. Exposing this enormous variety to the world is a scary proposition for any data scientist.
  4. Voice:  your open data becomes the voice of your organization to your stakeholders (including customers, clients, employees, sponsors, and the public).
  5. Vocabulary:  the semantics and schema (data models) that describe your data are more critical than ever when you provide the data for others to use. Search, discovery, and proper reuse of data all require good metadata, descriptions, and data modeling.
  6. Vulnerability:  the frequency of data theft and hacking incidents has increased dramatically in recent years — and this even applies to data that are well protected. The likelihood that your data will be compromised is even greater when the data are released “into the wild”. Obviously, theft of open data isn’t the problem! But, data security can be a major issue for open data, which are much more vulnerable to misuse, abuse, manipulation, or alteration.
  7. proVenance (okay, this is a “V” in the middle, but provenance is absolutely central to data curation and validity, especially for Open Data):  maintaining a formal permanent record of the lineage of open data is essential for its proper use and understanding. Provenance includes ownership, origin, chain of custody, transformations that have been made to it, processing that has been applied to it (including which versions of processing software were used), the data’s uses, their context, and more.

Here are some sources and meta-sources of open data [UPDATED October 2023]:

We have not even tried to list here the thousands of open data sources in specific disciplines, such as the sciences, including astronomy, medicine, climate, chemistry, materials science, and much more.

The Sunlight Foundation has published an impressively detailed list of 30+ Open Data Policy Guidelines at http://sunlightfoundation.com/opendataguidelines/. These guidelines cover the following topics (and more) with several real policy examples provided for each: (a) What data should be public? (b) How to make data public? (c) Creating permanent and lasting access to data. (d) Mandating the use of unique identifiers. (e) Creating public APIs for accessing information. (f) Creating processes to ensure data quality.

Related to open data initiatives, the W3C Working Group for “Data on the Web Best Practices” has published a Data Quality Vocabulary (to express the data’s quality), including these quality metrics for data on the web (which are related to our 7 V’s of open data that we described above):

  1. Availability
  2. Processability
  3. Accuracy
  4. Consistency
  5. Relevance
  6. Completeness
  7. Conformance
  8. Credibility
  9. Timeliness

Follow Kirk Borne on Twitter @KirkDBorne

Blogging My Way Through Data Science, Big Data, and Analytics

I frequently write blog posts on other sites.  You can find those articles here (updated March 21, 2016):

I also write “one-off” blog posts, such as these examples:

Follow Kirk Borne on Twitter @KirkDBorne

What Motivates a Data Scientist?

I recently had the pleasure of being interviewed by Manu Jeevan for his Big Data Made Simple blog.  He asked me several questions:

  • How did you get into data science?
  • What exactly is enterprise data science?
  • How does Booz Allen Hamilton use data science?
  • What skills should business executives have to effectively to communicate with data scientists?
  • How is big data changing the world? (Please give us interesting examples)
  • What are your go-to tools for doing data science?
  • In your TedX talk Big Data, Small World you gave special attention to association discovery, is there a specific reason for that?
  • The Data Scientist has been called the sexiest job of the 21st century. Do you agree?
  • What advice would you give to people aspiring for a long career in data science?

All of these questions were ultimately aimed at understanding the key underlying question: “What motivates you to work in data science?” The question about enterprise data science really comes the closest to identifying what really motivates me — that is, I am exceedingly fortunate every day to be given the opportunity to work with a fantastic team of data scientists at Booz Allen Hamilton, with the mandate to explore data as a corporate asset and to exploit data science as a core capability in order to achieve more profound discoveries, to make better (data-driven) decisions, and to propel new innovations across numerous domains, industries, agencies, and organizations. My Data Science Declaration also sums up these motivating factors for me.

You can see the full scope of my answers to the above questions here: http://bigdata-madesimple.com/interview-with-leading-data-science-expert-kirk-borne/.

Follow Kirk Borne on Twitter @KirkDBorne

Just-in-Time Supply Chain Management with Data Analytics

A common phrase in SCM (Supply Chain Management) is Just-In-Time (JIT) inventory. JIT refers to a management strategy in which raw materials, products, or services are delivered to the right place, at the right time, as demand requires. This has always been an excellent business goal, but the power to excel at JIT inventory management is now improving dramatically with the increased use of data analytics across the supply chain.

In the article “Operational Analytics and Droning About Big Data“, we discussed two examples of JIT: (1) a just-in-time supply replenishment system for human bases on the Moon, and (2) the proposal by Amazon to use drones to deliver products to your front door “just in time”! The Internet of Things will almost certainly generate similar use cases and benefits.

Descriptive analytics (hindsight) tells you what has already happened in your supply chain. If there was a deficiency or problem somewhere, then you can react to that event. But, that is “old school” supply chain management. Modern analytics is predictive (foresight), allowing you to predict where the need will occur (in advance) so that you can proactively deliver products and services at the point of need, just in time.

The next advance in analytics is prescriptive (insight), which uses optimization techniques (from operations research) in combination with insights and knowledge of your business (systems, processes, and resources) in order to optimize your delivery systems, for the best possible outcome (greater sales, fewer losses, reduced inventory, etc.). Just-in-time supply chain management then becomes something more than a reality — it now becomes an enabler of increased efficiency and productivity.

Many more examples of use cases in the manufacturing and retail industries (and elsewhere) where just-in-time analytics is important (and what you can do about it) have been enumerated by the fast Automatic Modeling folks from Soft10, Inc. Check out their fast predictive analytics products at http://soft10ware.com/.

(Read more about these ideas at: https://www.linkedin.com/pulse/supply-chain-data-analytics-jit-legit-kirk-borne)

Follow Kirk Borne on Twitter @KirkDBorne