Tag Archives: Data Science

Top 10 Conversations That You Don’t Want to Have on Data Privacy Day

On January 28, the world observes Data Privacy Day. Here are the top 10 conversations that you do not want to have on that day. Let the countdown begin….

10.  CDO (Chief Data Officer) speaking to Data Privacy Day event manager who is trying to re-schedule the event for Father’s Day: “Don’t do that! It’s pronounced ‘Day-tuh’, not ‘Dadda’.”

9.  CDO speaking at the company’s Data Privacy Day event regarding an acronym that was used to list his job title in the event program guide: “I am the company’s Big Data ‘As A Service’ guru, not the company’s Big Data ‘As Software Service’ guru.”  (Hint: that’s BigData-aaS, not BigData-aSS)

8.  Data Scientist speaking to Data Privacy Day session chairperson: “Why are all of these cows on stage with me? I said I was planning to give a LASSO demonstration.”

​7.  Any person speaking to you: “Our organization has always done big data.”

6.  You speaking to any person: “Seriously? … The title of our Data Privacy Day Event is ‘Big Data is just Small Data, Only Bigger’.

5.  New cybersecurity administrator (fresh from college) sends this e-mail to company’s Data Scientists at 4:59pm: “The security holes in our data-sharing platform are now fixed. It will now automatically block all ports from accepting incoming data access requests between 5:00pm and 9:00am the next day.  Gotta go now.  Have a nice evening.  From your new BFF.”

4.  Data Scientist to new HR Department Analytics ​Specialist regarding the truckload of tree seedlings that she received as her end-of-year company bonus:  “I said in my employment application that I like Decision Trees, not Deciduous Trees.”

3.  Organizer for the huge Las Vegas Data Privacy Day Symposium speaking to the conference keynote speaker: “Oops, sorry.  I blew your $100,000 speaker’s honorarium at the poker tables in the Grand Casino.”

2.  Over-zealous cleaning crew speaking to Data Center Manager arriving for work in the morning after Data Privacy Day event that was held in the company’s shiny new Exascale Data Center: “We did a very thorough job cleaning your data center. And we won’t even charge you for the extra hours that we spent wiping the dirty data from all of those disk drives that you kept talking about yesterday.”

1.  Announcement to University staff regarding the Data Privacy Day event:  “Dan Ariely’s keynote talkBig Data is Like Teenage Sex‘ is being moved from room B002 in the Physics Department to the Campus Football Stadium due to overwhelming student interest.”

Follow Kirk Borne on Twitter @KirkDBorne

When Big Data Gets Local, Small Data Gets Big

We often hear that small data deserves at least as much attention in our analyses as big data. While there may be as many interpretations of that statement as there are definitions of big data, there are at least two situations where “small data” applications are worth considering. I will label these “Type A” and “Type B” situations.

In “Type A” situations, small data refers to having a razor-sharp focus on your business objectives, not on the volume of your data. If you can achieve those business objectives (and “answer the mail”) with small subsets of your data mountain, then do it, at once, without delay!

In “Type B” situations, I believe that “small” can be interpreted to mean that we are relaxing at least one of the 3 V’s of big data: Velocity, Variety, or Volume:

  1. If we focus on a localized time window within high-velocity streaming data (in order to mine frequent patterns, find anomalies, trigger alerts, or perform temporal behavioral analytics), then that is deriving value from “small data.”
  2. If we limit our analysis to a localized set of features (parameters) in our complex high-variety data collection (in order to find dominant segments of the population, or classes/subclasses of behavior, or the most significant explanatory variables, or the most highly informative variables), then that is deriving value from “small data.”
  3. If we target our analysis on a tight localized subsample of entries in our high-volume data collection (in order to deliver one-to-one customer engagement, personalization, individual customer modeling, and high-precision target marketing, all of which still require use of the full complexity, variety, and high-dimensionality of the data), then that is deriving value from “small data.”

(continue reading here: https://www.mapr.com/blog/when-big-data-goes-local-small-data-gets-big-part-1)

Follow Kirk Borne on Twitter @KirkDBorne

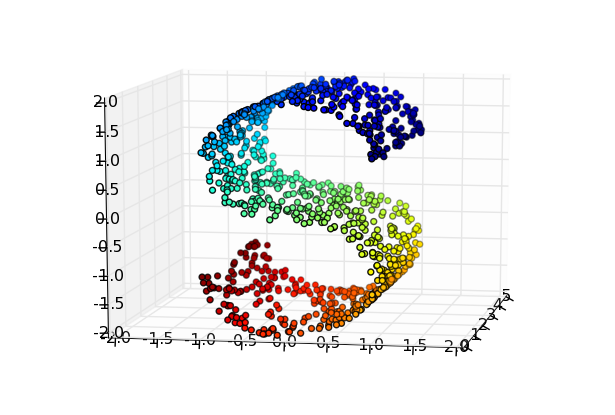
Local Linear Embedding(Image source**: http://mdp-toolkit.sourceforge.net/examples/lle/lle.html)

**Zito, T., Wilbert, N., Wiskott, L., Berkes, P. (2009). Modular toolkit for Data Processing (MDP): a Python data processing frame work, Front. Neuroinform. (2008) 2:8. doi:10.3389/neuro.11.008.2008

New Directions for Big Data and Analytics in 2015

The world of big data and analytics is remarkably vibrant and marked by incredible innovation, and there are advancements on every front that will continue into 2015. These include increased data science education opportunities and training programs, in-memory analytics, cloud-based everything-as-a-service, innovations in mobile (business intelligence and visual analytics), broader applications of social media (for data generation, consumption and exploration), graph (linked data) analytics, embedded machine learning and analytics in devices and processes, digital marketing automation (in retail, financial services and more), automated discovery in sensor-fed data streams (including the internet of everything), gamification, crowdsourcing, personalized everything (medicine, education, customer experience and more) and smart everything (highways, cities, power grid, farms, supply chain, manufacturing and more).

Within this world of wonder, where will we wander with big data and analytics in 2015? I predict two directions for the coming year…

(continue reading herehttp://www.ibmbigdatahub.com/blog/new-directions-big-data-and-analytics-2015)

Follow Kirk Borne on Twitter @KirkDBorne

Feature Mining in Big Data

We love features in our data, lots of features, in the same way that we love features in our toys, mobile phones, cars, and other gadgets.  Good features in our big data collection empower us to build accurate predictive models, identify the most informative trends in our data, discover insightful patterns, and select the most descriptive parameters for data visualizations. Therefore, it is no surprise that feature mining is one aspect of data science that appeals to all data scientists. Feature mining includes: (1) feature generation (from combinations of existing attributes), (2) feature selection (for mining and knowledge discovery), and (3) feature extraction (for operational systems, decision support, and reuse in various analytics processes, dashboards, and pipelines).

Learn more about feature mining and feature selection for Big Data Analytics in these publications:

  1. Feature-Rich Toys and Data
  2. Interactive Visualization-enabled Feature Selection and Model Creation
  3. Feature Selection (available on the National Science Bowl blog site)
  4. Feature Selection Methods used with different Data Mining algorithms
  5. (and for heavy data science pundits) Computational Methods of Feature Selection

Follow Kirk Borne on Twitter @KirkDBorne

6 Ways To Be Fooled by Randomness

Randomness refers to the absence of patterns, order, coherence, and predictability in a system. Consequently, in data science, randomness in your data can negate the value of a predictive analytics model.

It is easy to be fooled by randomness. We often see randomness when there is none, and vice versa. Here are 6 ways in which we can be fooled by randomness:

  1. We often tend to pick out and focus on the “most interesting” results in our data, and ignore the uninteresting cases.  For example, if you toss a coin 2000 times, and you see a subsequence of 12 consecutive Heads in the sequence, then your attention is directed to this interesting subsequence (and you might conclude that there is something unfair about the coin or the coin tossing) even though it is statistically reasonable for such a subsequence to appear. This is selection bias, and it is also an example of “a posteriori” statistics (derived from observed facts, not from logical principles).
  2. We may unintentionally overlook the randomness in the data, especially in our rush to build predictive analytics models.
  3. Randomness sometimes appears to behave opposite to what our intuition would suggest. An example of this is the famous birthday paradox (in which the likelihood that two people in a crowd have the same birthday is approximately 50% when there are only 23 people in the group). This 50-50 break point occurs at such a small number because, as you increase the sample size, it becomes less and less likely to avoid the same birthday (i.e., less and less likely to avoid a repeating pattern in random data).
  4. Humans are good at seeing patterns and correlations in data, but humans are less good at remembering that correlation does not imply causation.
  5. The bigger the data set, the more likely you will see an “unlikely” pattern!
  6. When asked to pick the “random” statistical distribution that is generated by a human (versus a distribution generated by an algorithm), we tend to confuse “randomness” with the “appearance of randomness”. A distribution may appear to be more random, but in fact it is less random, since it has a statistically unrealistic small variance in behavior.

We consider 3 examples of randomness in order to test our ability to recognize it…

(continue reading herehttp://www.analyticbridge.com/profiles/blogs/7-traps-to-avoid-being-fooled-by-statistical-randomness)

Follow Kirk Borne on Twitter @KirkDBorne

Machine Unlearning and The Value of Imperfect Models

Common wisdom states that “perfect is the enemy of good enough.” We can apply this wisdom to the machine learning models that we train and deploy for big data analytics. If we strive for perfection, then we may encounter several potential risks. It may be useful therefore to pay attention to a little bit of “machine unlearning.” For example:

Overfitting

By attempting to build a model that correctly follows every little nuance, deviation, and variation in our data set, we are consequently almost certainly fitting the natural variance in the data, which will never go away.  After building such a model, we may find that it has nearly 100% accuracy on the training data, but significantly lower accuracy on the test data set.  These test results are guaranteed proof that we have overfit our model. Of course, we don’t want a trivial model (an underfit model) either – to paraphrase Albert Einstein: “models should be as simple as possible, but no simpler.”

(continue reading herehttps://www.mapr.com/blog/machine-unlearning-value-imperfect-models)

Follow Kirk Borne on Twitter @KirkDBorne

Kurtosis: Four Momentous Uses of A Statistical Orphan in the Era of Big Data

We frequently see much use of and commentary on the mean, medians, and modes of statistical distributions, as well as lengthy discussions of variance and skew (including the now famous “long tail“). But, what about fat tails? Is that a taboo subject? Maybe it is! For example, in the widely respected book Numerical Recipes: The Art of Scientific Computing, the authors had the audacity to say “the skewness (or third moment) and the kurtosis (or fourth moment) should be used with caution or, better yet, not at all.” Those warnings notwithstanding, kurtosis is making a comeback. Not that it ever went away, but a recent search on Google Scholar found over 3000 articles mentioning kurtosis in the context of statistics within the first three months of 2014, and over 12,000 articles in 2013, though only about 4000 such articles were cited in the preceding three years combined. Many of those contributions focus on real-world uses of that particular characteristic of data distributions.

So, what is kurtosis and what applications can we find for it in the Big Data world of Data Science?

(continue reading herehttp://www.statisticsviews.com/details/feature/6047711/Kurtosis-Four-Momentous-Uses-for-the-Fourth-Moment-of-Statistical-Distributions.html)

Follow Kirk Borne on Twitter @KirkDBorne

Outlier Detection Gets a New Look – Surprise Discovery in Big Data

Novelty and surprise are two of the more exciting aspects of science – finding something totally new and unexpected can lead to a quick research paper, or it can make your career. As scientists, we all yearn to make a significant discovery. Petascale big data collections potentially offer a multitude of such opportunities. But how do we find that unexpected thing? These discoveries come under various names: interestingness, outlier, novelty, anomaly, surprise, or defect (depending on the application). Outlier? Anomaly? Defect? How did they get onto this list? Well, those features are often the unexpected, interesting, novel, and surprising aspects (patterns, points, trends, and/or associations) in the data collection. Outliers, anomalies, and defects might be insignificant statistical deviants, or else they could represent significant scientific discoveries.

(continue reading herehttp://stats.cwslive.wiley.com/details/feature/6597751/Outlier-Detection-Gets-a-Makeover—Surprise-Discovery-in-Scientific-Big-Data.html)

Follow Kirk Borne on Twitter @KirkDBorne

The Power of Three: Big Data, Hadoop, and Finance Analytics

Big data is a universal phenomenon. Every business sector and aspect of society is being touched by the expanding flood of information from sensors, social networks, and streaming data sources. The financial sector is riding this wave as well. We examine here some of the features and benefits of Hadoop (and its family of tools and services) that enable large-scale data processing in finance (and consequently in nearly every other sector).

Three of the greatest benefits of big data are discovery, improved decision support, and greater return on innovation. In the world of finance, these also represent critical business functions….

(continue reading here:  https://www.mapr.com/blog/potent-trio-big-data-hadoop-and-finance-analytics)

Follow Kirk Borne on Twitter @KirkDBorne

Numbers are Powerful, Especially in Combination

The phrase “Big Data” refers to a set of serious analytical challenges that arise when the data increase in quantity, real-time speed, and complexity.  The three V’s of big data (Volume, Velocity, and Variety) are now well known and well worn. Their familiarity and frequent association with “big data hype” may numb us to the important data challenges that they are meant to represent. These three characterizations have their counterparts in tools and technologies.  For example, Hadoop (Apache’s open source implementation of the MapReduce programming model) is the technology du jour for management and analysis of high-volume data.  The Hadoop Distributed File System (HDFS) is the file system for big data storage and access in Hadoop clusters.  Apache Spark is a computing framework (built on HDFS) for fast processing of high-velocity data.

But, what about high-variety data?  The storage and management challenges of such data are already addressed (see above), but the real challenge is in performing effective and efficient statistical modeling, data mining, and discovery across high-dimensional (complex) data sets.  Software tools like Soft10 Inc.‘s “automatic statistician” Dr. Mo are designed to address that specific challenge.

When considering complex (high-variety) data, it is important to note that even relatively small-volume data sets can pose huge challenges to modeling, mining, and analysis algorithms and tools. For example, consider a gigabyte data table with a billion entries. If those entries correspond to 500 million rows and 2 columns, then some relatively simple “textbook” techniques can be applied: e.g., correlation analysis, regression analysis, Naïve Bayes, etc. However, if those entries correspond to one million rows and 1000 columns, then the complexity of the data analysis explodes exponentially.

It is not hard to find data sets that are at least this complex, if not much worse.  For example, the human genome consists of 3 billion base pairs (of just four bases: A, C, G, T) – the number of possible sequences of length 3 billion that can be formed from just four items is 4 to the power of 3 billion (limited of course by various genetic constraints). Another example will be the astronomical database to be obtained in the 10-year survey of the sky by the Large Synoptic Survey Telescope (lsst.org) – the final source table will consist of approximately 20 trillion rows and over 200 columns of scientific information per source.  Analyses of all possible combinations of these scientific parameters (to discover new correlations, patterns, associations, clusters, etc.) would be prohibitive.

The combinatorial theorem in mathematics tells us that there are (2^N – 1) possible combinations of N things. For example, a statistical analysis of a data table with just 3 columns (A,B,C) would require 7 distinct analyses (statistical models) of the behavior of the data: A, B, C, A with B, B with C, A with C, and with all three taken at once.  A data table with 5 columns would require 31 distinct analyses; and a table with 25 columns would require over 33 million distinct analyses. My calculator tells me that the number of distinct combinations of 200 variables is greater than 10^60.  This extraordinarily rapid growth rate is called the “combinatorial explosion”.  While no software package could ever perform that many variations of high-dimensional data analysis, it is common to focus on joint combinations of fewer parameters.  Even pairs, triples, and similar small-number combinations can have significant correlation and covariance, consequently yielding important discoveries.

Therefore, in order to meet the challenge of big data complexity (high variety), fast modeling technology is needed.  Such tools provide big benefits to both statisticians and non-statisticians.  These benefits multiply favorably when the technology can automatically build and test a large number of models (different combinations of parameters) in parallel.  Furthermore, the power of the technology is even more enhanced when it ranks the output models and parameter selection in order of significance and correlation strength.  Soft10’s “automatic statistician” Dr. Mo does these things and more. Dr. Mo models complex high-dimensional data both row-wise and column-wise. Dr. Mo produces high-accuracy predictions.  Dr. Mo’s proprietary multi-model technology is a powerful tool for predictive modeling and analytics across many application domains, including medicine and health, finance, customer analytics, target marketing, nonprofits, membership services, and more. Check out Dr. Mo at http://soft10ware.com/ and read more herehttp://soft10ware.com/big-data-complexity-requires-fast-modeling-technology/

Kirk Borne is a member of the Soft10, Inc. Board of Advisors.

Follow Kirk Borne on Twitter @KirkDBorne