Tag Archives: Big Data

Blogging My Way Through Data Science, Big Data, and Analytics

I frequently write blog posts on other sites.  You can find those articles here (updated March 21, 2016):

I also write “one-off” blog posts, such as these examples:

Follow Kirk Borne on Twitter @KirkDBorne

What Motivates a Data Scientist?

I recently had the pleasure of being interviewed by Manu Jeevan for his Big Data Made Simple blog.  He asked me several questions:

  • How did you get into data science?
  • What exactly is enterprise data science?
  • How does Booz Allen Hamilton use data science?
  • What skills should business executives have to effectively to communicate with data scientists?
  • How is big data changing the world? (Please give us interesting examples)
  • What are your go-to tools for doing data science?
  • In your TedX talk Big Data, Small World you gave special attention to association discovery, is there a specific reason for that?
  • The Data Scientist has been called the sexiest job of the 21st century. Do you agree?
  • What advice would you give to people aspiring for a long career in data science?

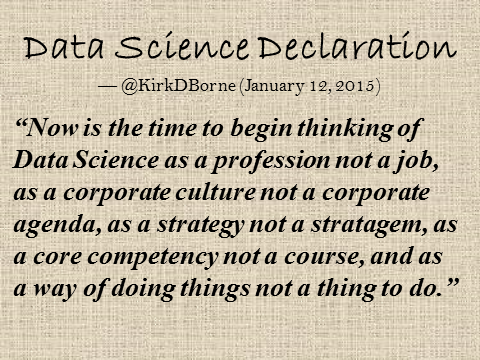
All of these questions were ultimately aimed at understanding the key underlying question: “What motivates you to work in data science?” The question about enterprise data science really comes the closest to identifying what really motivates me — that is, I am exceedingly fortunate every day to be given the opportunity to work with a fantastic team of data scientists at Booz Allen Hamilton, with the mandate to explore data as a corporate asset and to exploit data science as a core capability in order to achieve more profound discoveries, to make better (data-driven) decisions, and to propel new innovations across numerous domains, industries, agencies, and organizations. My Data Science Declaration also sums up these motivating factors for me.

You can see the full scope of my answers to the above questions here: http://bigdata-madesimple.com/interview-with-leading-data-science-expert-kirk-borne/.

Follow Kirk Borne on Twitter @KirkDBorne

Analytics Maturity Models

In the world of big data analytics, there are several emerging standards for measuring Analytics Capability Maturity within organizations.  One of these has been presented in the TIBCO Analytics Maturity Journey – their six steps toward analytics maturity are:  Measure, Diagnose, Predict and Optimize, Operationalize, Automate, and Transform.  Another example is presented through the SAS Analytics Assessment, which evaluates business analytics readiness and capabilities in several areas.  The B-eye Network Analytics Maturity Model mimics software engineering’s CMM (Capability Maturity Model) – their 6 levels of maturity are:  Level 0 = Incomplete; Level 1 = Performed; Level 2 = Managed; Level 3 = Defined, Level 4 = Quantitatively Managed; and Level 5 = Optimizing.

The most “mature” standard in the field is probably the IDC Big Data and Analytics (BDA) MaturityScape Framework.  This BDA framework (measured across the five core dimensions of intent, data, technology, process, and people) consists of five stages of maturity, which essentially parallel the others mentioned above:  Ad hoc, Opportunistic, Repeatable, Managed, and Optimized.

All of these are excellent models for analytics maturity.  But, if you find these different models to be too theoretical or opaque or unattainable, then I suggest a more practical model for your business analytics progression from ground zero all of the way up to cognitive analytics:  from Descriptive and Diagnostic, to Predictive, to Prescriptive, and finally to Cognitive.

A specific example from the field of Marketing is SYNTASA‘s PMI (Personalization Maturity Index). Personalization Capability Maturity parallels the Analytics Capability Maturity frameworks within the specific context of data-driven customer-centric one-to-one marketing and segmentation of one. Read more about this in the article The Battle for Customer Personalization – Divisive Clustering is Good For Youand in much more detail within SYNTASA’s PMI white paper linked above.

(continue reading here:  https://www.mapr.com/blog/raising-standard-big-data-analytics-profession)

Follow Kirk Borne on Twitter @KirkDBorne


Drilling Through Data Silos with Apache Drill

Enterprise data collections are typically stored in silos belonging to different business divisions. Sometimes these silos belong to different projects within the same division. These silos may be further segmented by services/products and functions. Silos (which stifle data-sharing and innovation) are often identified as a primary impediment (both practically and culturally) to business progress and thus they may be the cause of numerous difficulties. For example, streamlining important business processes are rendered more challenging, ranging from compliance to data discovery. But, breaking down the silos may not be so easy to accomplish. In fact, it is often infeasible due to ownership issues, governance practices, and regulatory concerns.

Big Data silos create additional complications including data duplication (and associated increased costs), complicated data replication solutions, high data latency, and data quality concerns, not to mention being an enabler of the real problematic situation where your data repositories could hold different versions of the truth. The silos also put a limit on business intelligence (discovery and actionable insights). As big data best practices rise above the hype and noise, we now know that actionable value is more easily extracted when multiple data sets can be integrated and viewed holistically.

Data analysts naturally want to break down silos to combine data from multiple data sources. Unfortunately, this can create its own bottleneck: a complex integration labyrinth—which is costly to maintain, rarely performs well, and can’t be guaranteed to provide consistent results.

In response, many companies have deployed Apache Hadoop to address the problem of segregated data. Hadoop enables multiple types of data to be directly processed in place, and it fully supports data integration from multiple sources across different data storage technologies.

Organizations that use Hadoop are finding additional benefits with Apache Drill, which is the open source version of Google’s Dremel system…

(continue reading here https://www.mapr.com/blog/drive-innovation-breaking-down-data-silos-apache-drill)

Follow Kirk Borne on Twitter @KirkDBorne

A Growth Hacker’s Journey Through the Recent History of Data Science

In 1998, I was attending a conference when an astronomer that I knew from across the country sought me out and asked if his group could send the data from their large astronomy experiment to NASA’s ADF (Astrophysics Data Facility, where I was working at the time). Their data set was two Terabytes in total. That seemed big (like the birth of “Astronomy Big Data”) to me, especially for 1998, but I didn’t know how big until I went back to work a few days later. When I mentioned this opportunity to the NASA facility senior managers, they looked at me like I was unaware of something really obvious and important. They were right! They “reminded” me that the data facility was the home for 15,000 NASA space science mission data sets, and the aggregate sum total data volume for all of those data sets combined(!) was less than one Terabyte! They couldn’t possibly accept one single experiment’s data that single-handedly eclipsed the total volume of all of the other 15,000 experiments’ data sets combined.

Well, this was embarrassing! What could we do? I was told that ADF could accept the data if I would write a research grant proposal and win some funds to pay for all of the new I.T. resources that would be required. “What kind of research proposal would pay for such a thing?” I asked myself. This led me to investigate a field of research that I had only briefly heard in conversation once or twice previously — Data Mining (= Machine Learning applied to large data sets). The more I read about this topic (now called Data Science), the more I became convinced that this is what I wanted to do for the rest of my research career. I was hooked. I was at the right place at the right time…

(continue reading herehttps://www.mapr.com/blog/growth-hackers-journey-right-place-right-time)

Follow Kirk Borne on Twitter @KirkDBorne

These are a few of my favorite things… in Big Data and Data Science: A to Z

A while back, we made a list from A to Z of a few of our favorite things in big data and data science. We have made a lot of progress toward covering several of these topics. Here’s a handy list of the write-ups that I have completed so far:

AAssociation rule mining:  described in the article “Association Rule Mining – Not Your Typical Data Science Algorithm.”

C – Characterization:  described in the article “The Big C of Big Data: Top 8 Reasons that Characterization is ‘ROIght’ for Your Data.”

H – Hadoop (of course!):  described in the article “H is for Hadoop, along with a Huge Heap of Helpful Big Data Capabilities.” To learn more, check out the Executive’s Guide to Big Data and Apache Hadoop, available as a free download from MapR.

K – K-anything in data mining:  described in the article “The K’s of Data Mining – Great Things Come in Pairs.”

L – Local linear embedding (LLE):  is described in detail in the blog post series “When Big Data Goes Local, Small Data Gets Big – Part 1” and “Part 2

N – Novelty detection (also known as “Surprise Discovery”):  described in the articles “Outlier Detection Gets a Makeover – Surprise Discovery in Scientific Big Data” and “N is for Novelty Detection…” To learn more, check out the book Practical Machine Learning: A New Look at Anomaly Detection, available as a free download from MapR.

P – Profiling (specifically, data profiling):  described in the article “Data Profiling – Four Steps to Knowing Your Big Data.”

Q – Quantified and Tracked:  described in the article “Big Data is Everything, Quantified and Tracked: What this Means for You.”

R – Recommender engines:  described in two articles: “Design Patterns for Recommendation Systems – Everyone Wants a Pony” and “Personalization – It’s Not Just for Hamburgers Anymore.” To learn more, check out the book Practical Machine Learning: Innovations in Recommendation, available as a free download from MapR.

S – SVM (Support Vector Machines):  described in the article “The Importance of Location in Real Estate, Weather, and Machine Learning.”

Z – Zero bias, Zero variance:  described in the article “Statistical Truisms in the Age of Big Data.”

Where to get your Data Science Training or Apprenticeship

I am frequently asked for suggestions regarding academic institutions, professional organizations, or MOOCs that provide Data Science training.  The following list will be updated occasionally (LAST UPDATED: 2018 March 29) .

Also, be sure to check out The Definitive Q&A for Aspiring Data Scientists and the story of my journey from Astrophysics to Data Science. If the latter story interests you, then here are a couple of related interviews: “Data Mining at NASA to Teaching Data Science at GMU“, and “Interview with Leading Data Science Expert“.

Here are a few places to check out:

  1. The Booz Allen Field Guide to Data Science
  2. Do you have what it takes to be a Data Scientist? (get the Booz Allen Data Science Capability Handbook)
  3. http://www.thisismetis.com/explore-data-science-online-training (formerly exploredatascience.com at Booz-Allen)
  4. http://www.thisismetis.com/
  5. https://www.teamleada.com/
  6. MapR Academy (offering Free Hadoop, Spark, HBase, Drill, Hive training and certifications at MapR)
  7. Data Science Apprenticeship at DataScienceCentral.com
  8. (500+) Colleges and Universities with Data Science Degrees
  9. List of Machine Learning Certifications and Best Data Science Bootcamps
  10. NYC Data Science Academy
  11. NCSU Institute for Advanced Analytics
  12. Master of Science in Analytics at Bellarmine University
  13. http://www.districtdatalabs.com/ (District Data Labs)
  14. http://www.dataschool.io/
  15. http://www.persontyle.com/school/ 
  16. http://www.galvanize.it/education/#classes (formerly Zipfian Academy) includes http://www.galvanizeu.com/ (Data Science, Statistics, Machine Learning, Python)
  17. https://www.coursera.org/specialization/jhudatascience/1
  18. https://www.udacity.com/courses#!/data-science 
  19. https://www.udemy.com/courses/Business/Data-and-Analytics/
  20. http://insightdatascience.com/ 
  21. Data Science Master Classes (at Datafloq)
  22. http://datasciencemasters.org
  23. http://www.jigsawacademy.com/
  24. https://intellipaat.com/
  25. http://www.athenatechacademy.com/ (Hadoop training, and more)
  26. O’Reilly Media Learning Paths
  27. http://www.godatadriven.com/training.html
  28. Courses for Data Pros at Microsoft Virtual Academy
  29. 18 Resources to Learn Data Science Online (by Simplilearn)
  30. Learn Everything About Analytics (by AnalyticsVidhya)
  31. Data Science Masters Degree Programs

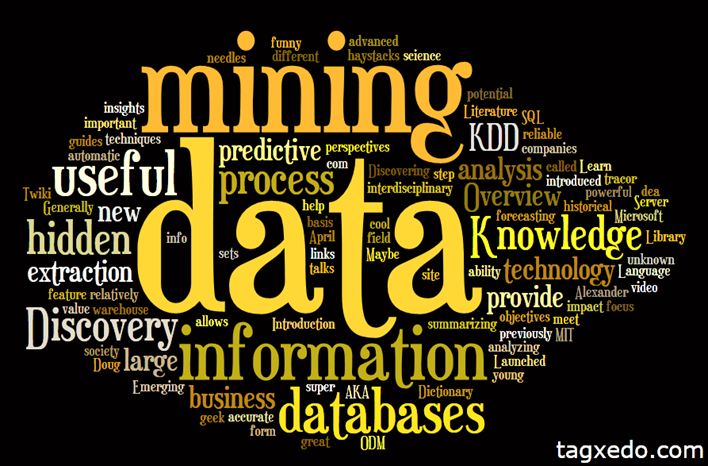
DataMiningTagCloudTagxedoWordCloud

Follow Kirk Borne on Twitter @KirkDBorne

Big Data Growth — Compound Interest on Steroids

(This article was originally published on BigDataRepublic.com in June 2013 — that site no longer exists.)

Could a simple math formula be responsible for all of modern civilization? An article in 2013 hypothesized that there is one, and the Formula for Compound Interest is it. The formula is actually quite straightforward, but the mathematical consequences are huge and potentially impossible to assimilate. Let us illustrate this with a simple example, and then we will see the consequences for the current Big Data revolution.

Assuming an annual period of compounding, if your principal (asset or debt) P grows at an annual rate R, then your net accumulation A after one year is P*(1+R). The accumulation A grows by an additional (1+R) factor for each additional year. Therefore, your accumulation after N years is equal to A=P*(1+R)N.

The fact that the number of compounding periods N is in the exponent of the compound interest growth formula means two things: (1) the growth rate is exponential (by definition); and (2) because the growth rate is exponential, the total accumulation A after a modest number of compounding periods can easily dwarf the initial value P, particularly for values of R equal to several percent per annum (or greater).

Many people have experienced the power of this compound interest growth through their own personal long-term retirement contributions. If you make a one-time investment of $5000 at age 20 (with no other contributions for the rest of your working career), then an annual return rate R=8% will yield a balance of $160,000 at 65 years old (a net gain of over 3000%).  If you make more modest but systematic contributions (for example $400 each year), then the final value of your retirement fund would also be $160,000 (from a total personal investment of $18,000 over 45 years – a net gain of 800%). This compound interest growth is amazing and impressive. Most people can understand these numbers and can relate them to normal life experience.

But consider what happens if the annual rate R is not a few percent, but double-digit or triple-digit percent. For example: if R=100%, then a $1 investment each year starting at age 20 would produce a net accumulation of $1024 after 10 years (from just $10 total personal investment). The net accumulation after 45 years at age 65 (from a total personal investment of $45) would equal $35,000,000,000,000 – that is, thirty-five trillion dollars! In this case, the mathematical consequences are enormous and too mind-boggling to comprehend. It is off-the-charts and unbelievable, and yet it is a mathematical certainty – the number (1+R) in the compound interest formula when R=100% is 2, and 245 is a truly huge number.

Finally, let us connect the original historical hypothesis to our current Big Data environment.  Some conservative estimates suggest that the world’s data volume doubles every year. That is a growth rate R=100%. Does that look familiar? Annual data-doubling corresponds to 210 times more data after every 10 years: from zettabytes now to geopbytes in a few decades (similar to investing $45 to get $35 trillion)!  The Big Data explosion is truly enormous growth on steroids! This is why Big Data is not simply “more data”, but it is something completely different, mind-boggling, and off-the-charts impossible to grasp. Nearly every government entity, corporate decision-maker, business strategist, marketing specialist, statistician, domain scientist, news service, digital publisher, and social media guru is talking “Big Data”. However, most of us involved in those conversations cannot begin to assimilate how the current growth in Big Data and a simple math formula will be responsible for radically transforming modern civilization all over again.

Therefore, don’t believe people when they say “We have always had Big Data!” That statement completely misses the point of today’s data revolution and trivializes the massive disruptive forces that are now transforming our digital world. Today’s big data is not yesterday’s big data!

Follow Kirk Borne on Twitter @KirkDBorne

Standards in the Big Data Analytics Profession

A sign of maturity for most technologies and professions is the appearance of standards. Standards are used to enable, to promote, to measure, and perhaps to govern the use of that technology or the practice of that profession across a wide spectrum of communities. Standardization increases independent applications and comparative evaluations of the tools and practices of a profession.

Standards often apply to processes and codes of conduct, but standards also apply to digital content, including: (a) interoperable data exchange (such as GIS, CDF, or XML-based data standards); (b) data formats (such as ASCII or IEEE 754); (c) image formats (such as GIF or JPEG); (d) metadata coding standards (such as ICD-10 for the medical profession, or the Dublin Core for cultural, research, and information artifacts); and (e) standards for the sharing of models (such as PMML, the predictive model markup language, for data mining models).

Standards are ubiquitous.  This abundance causes some folks to quip: “The nice thing about standards is that there are so many of them.”  So, it should not be surprising to note that standards are now beginning to appear also in the worlds of big data and data science, providing evidence of the growing maturity of those professions…

(continue reading herehttps://www.mapr.com/blog/raising-standard-big-data-analytics-profession)

Follow Kirk Borne on Twitter @KirkDBorne
My Data Science Declaration for 2015

Here it is… my Data Science Declaration for 2015 (posted to Twitter on January 14, 2015):

“Now is the time to begin thinking of Data Science as a profession not a job, as a corporate culture not a corporate agenda, as a strategy not a stratagem, as a core competency not a course, and as a way of doing things not a thing to do.”

DataScienceDeclaration


Follow Kirk Borne on Twitter @KirkDBorne