We live in a data-rich, insights-rich, and content-rich world. Data collections are the ones and zeroes that encode the actionable insights (patterns, trends, relationships) that we seek to extract from our data through machine learning and data science. The insights are used to produce informative content for stakeholders (decision-makers, business users, and clients). Content includes reports, documents, articles, presentations, visualizations, video, and audio representations of the insights and knowledge that have been extracted from data.
We could further refine our opening statement to say that our business users are too often in a state of being data-rich, but insights-poor, and content-hungry. With all the data in and around the enterprise, users would say that they have a lot of information but need more insights to assist them in producing better and more informative content. This is where we dispel an old “big data” notion (heard a decade ago) that was expressed like this: “we need our data to run at the speed of business.” Instead, what we really need is for our business to run at the speed of data. It is a major digital transformation challenge for businesses to keep up with data flows coming from a multitude of diverse sources, in different formats, at different cadences, on different dimensions of the enterprise, captured “safely” in different business silos. Transforming data to actionable insights and informative content needs some help!
AI is now helping in all these steps – not simply because it is “Artificial” intelligence, but primarily because AI is a tool for assisted, amplified, and augmented intelligence (the “new AI”) and because AI powers accelerated and automated intelligence, in order to deliver actionable intelligence. It appears that it’s AI everywhere all the time.
AI can help business users extract and produce (i.e., generate) informative content from insights. Plus, AI can also help find key insights encoded in data. And AI can help users find the appropriate data that they need from across the enterprise. In the language of Information Retrieval, AI delivers both high Recall (“did I get all the data that I need?”) and high Precision (“did I get only the data that I need?).
Discover the essential data – that’s AI.
Extract the essential insights from the data – that’s AI.
Produce essential content from the insights – that’s AI.
Well, okay, we can slap the “AI” label on everything, but what good is that? How are we helped when we board the AI hype train? In fact, by putting a single label like AI on all the steps of a data-driven business process, we have effectively not only blurred the process, but we have also blurred the particular characteristics that make each step separately distinct, uniquely critical, and ultimately dependent on specialized, specific technologies and business domain expertise at each step. This is where SAP Datasphere (the next generation of SAP Data Warehouse Cloud) comes in.
The new SAP Datasphere comprehensive data service provides powerful, seamless, and scalable access across the enterprise, across business departments, and across business silos to the specific mission-critical business data collection(s) that are needed for each unique business use case: access to external insights from data on the marketplace and competitors, access to internal insights from data on business processes and enterprise resources, and access to insights on customer-facing business products and services at the intersection of internal and external data sources.
So, if your business users don’t have access to the right data in the right context at the right time for the right business questions, then the whole business data workflow breaks down. SAP Datasphere has arrived to address those pain points, by enabling discovery, access, and integration of the heterogeneous data distributed across the enterprise. And so begins the process of insight discovery and content creation that meets the most significant, timely, and case-specific needs of decision-makers, business knowledge workers, and other stakeholders.
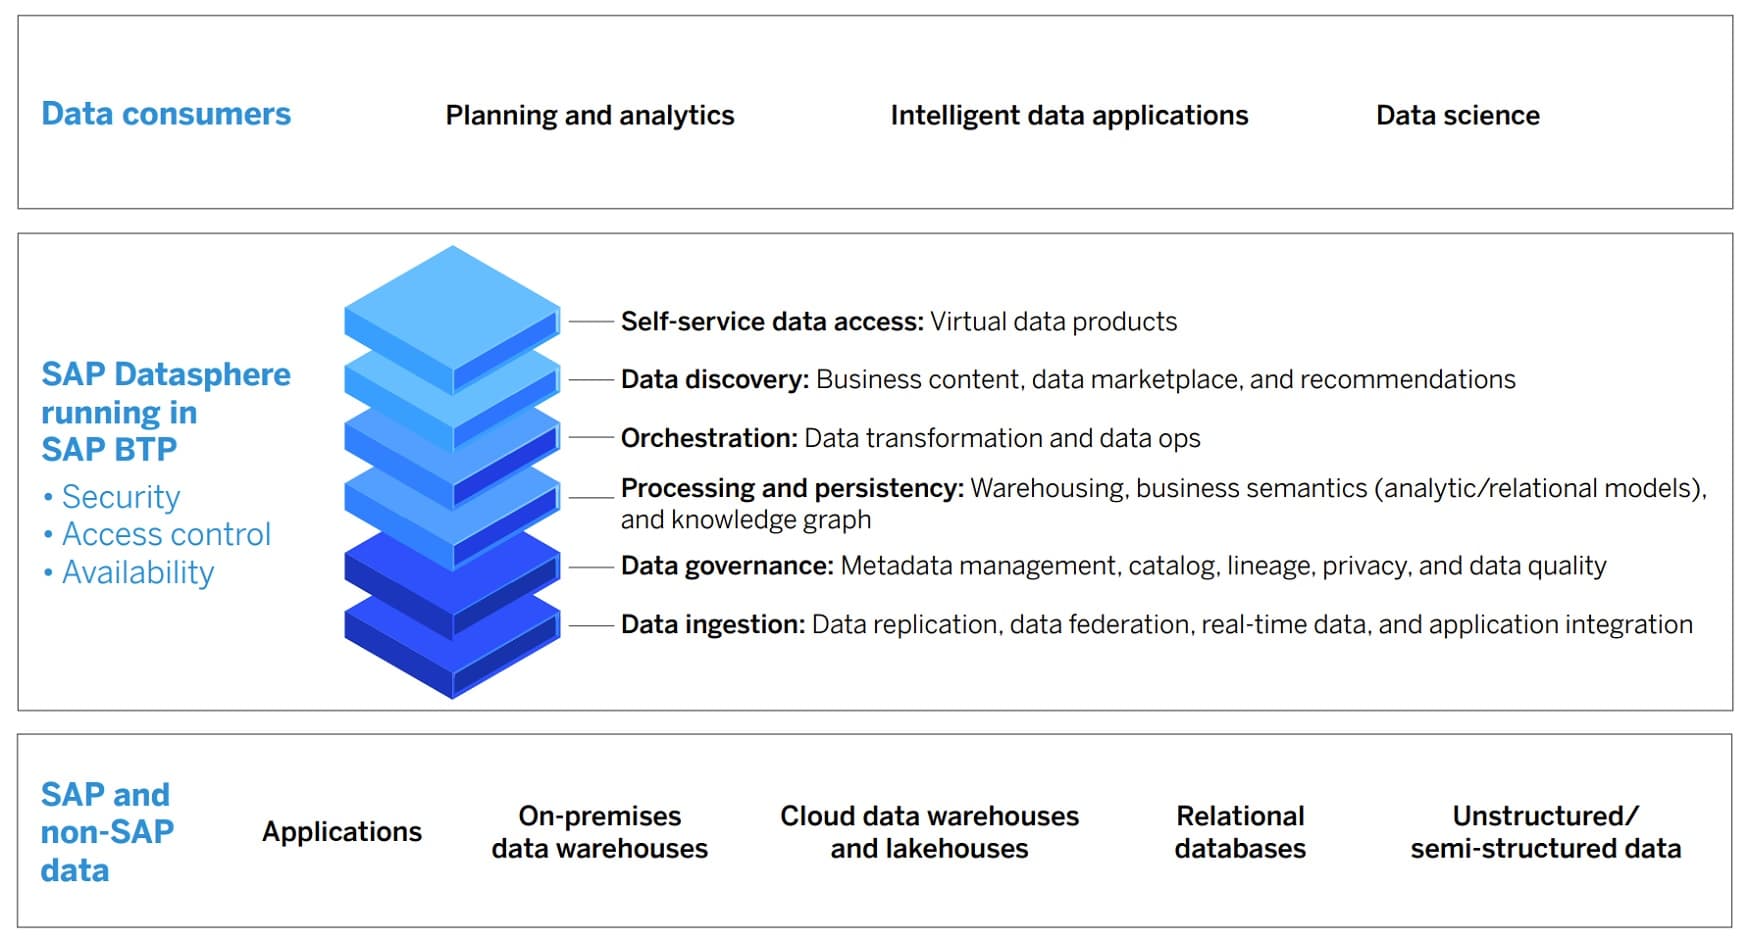
The release of SAP Datasphere was launched and announced globally on March 8, 2023. Live online presentations, demos, and customer testimonials were complemented with new content posted at sap.com/datasphere. Here are just 10 of the many key features of Datasphere that were covered during the launch day announcements:
- Datasphere works with the SAP Analytics Cloud and runs on the existing SAP BTP (Business Technology Platform), with all the essential features: security, access control, high availability.
- Datasphere accesses and integrates both SAP and non-SAP data sources into end-users’ data flows, including on-prem data warehouses, cloud data warehouses and lakehouses, relational databases, virtual data products, in-memory data, and applications that generate data (such as external API data loads).
- Datasphere manages and integrates structured, semi-structured, and unstructured data types.
- Datasphere empowers data democratization, by providing all business users with self-service data access, including virtual data products that can be stored, re-used, and shared.
- Datasphere is a data discovery tool with essential functionalities: recommendations, data marketplace, and business content (i.e., incorporates the business context of the data and data products that are being recommended and delivered).
- Datasphere goes beyond the “big three” data usage end-user requirements (ease of discovery, access, and delivery) to include data orchestration (data ops and data transformations) and business data contextualization (semantics, metadata, catalog services).
- Datasphere is an enhanced data warehousing service that includes business semantics (through both analytic and relational models) and a knowledge graph (linking business content with business context).
- Datasphere provides full-spectrum data governance: metadata management, data catalogs, data privacy, data quality, and data lineage (provenance) tracking.
- Datasphere provides all the outgoing data orchestration functions and incoming data ingestion functions, including replication, federation, real-time stream processing, and application integration.
- Datasphere is not just for data managers. It thrives with data consumers, who are doing planning, analytics, data science, and developing intelligent data applications – by providing those users with an end-to-end view of their data landscape in a trusted, secure, and actionable data environment.
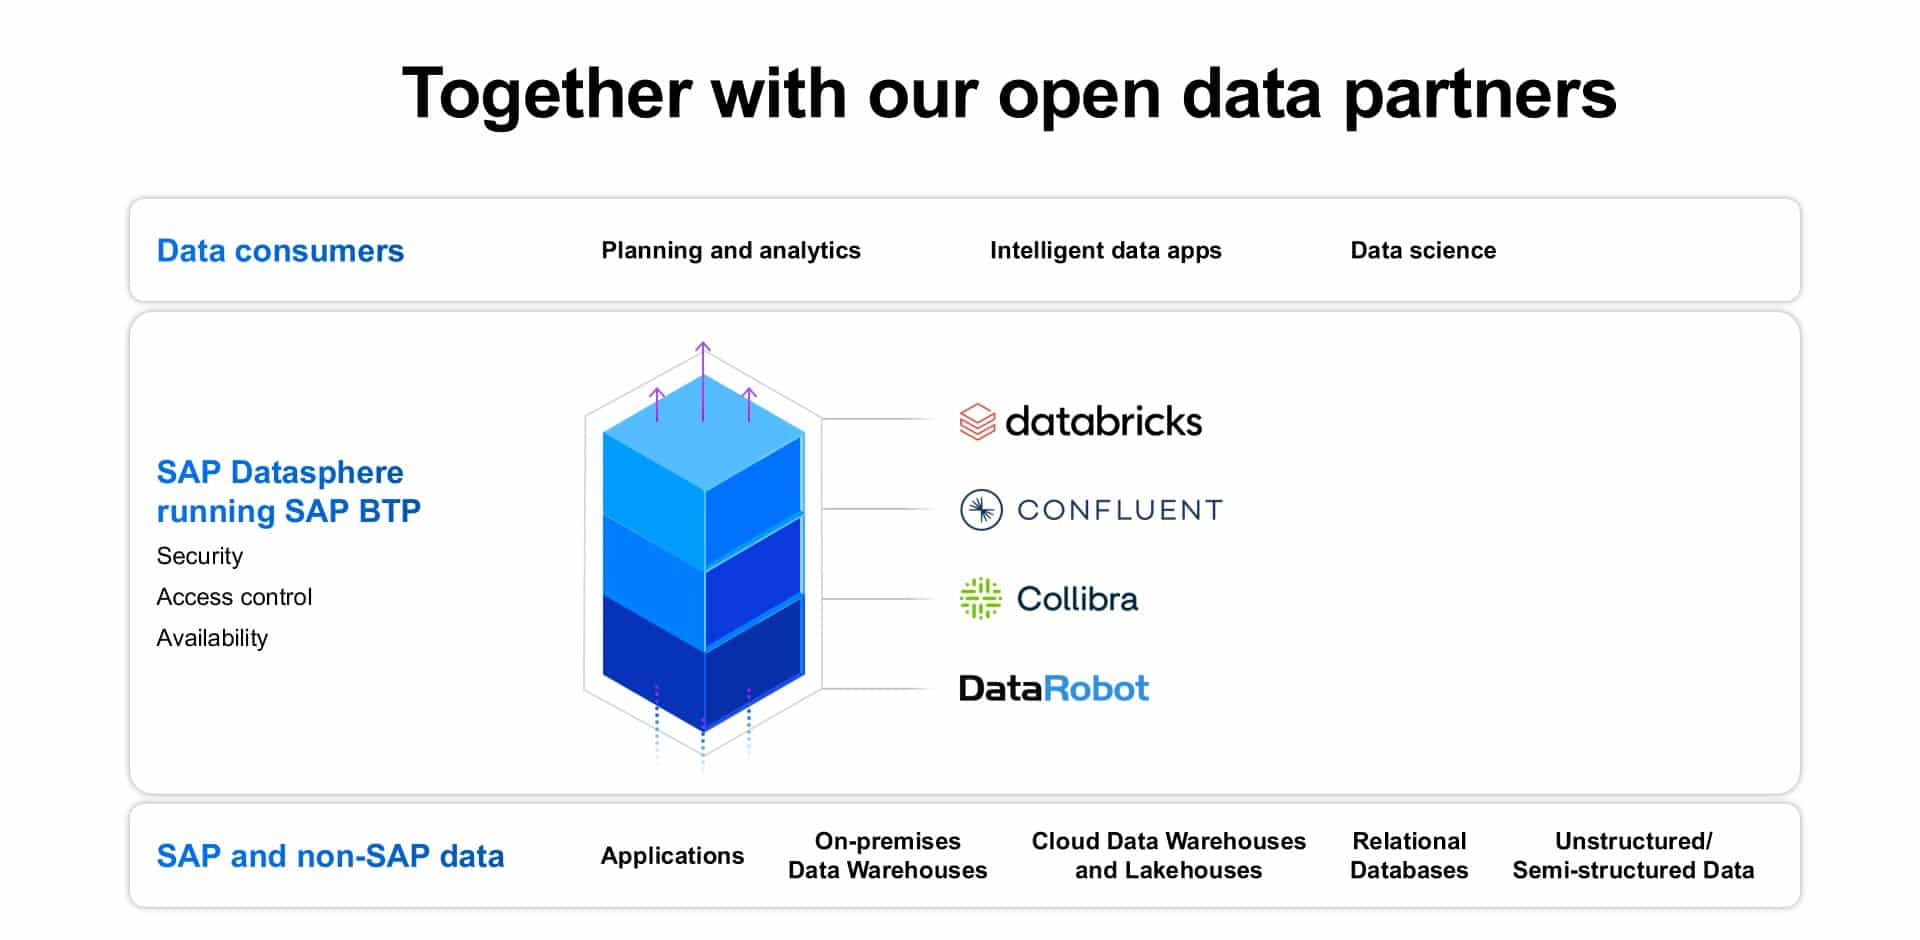
SAP also announced key partners that further enhance Datasphere as a powerful business data fabric. These partners are:
- Collibra – providing data governance and discovery (metadata, catalogs) across the entire data landscape.
- Confluent – providing access and discovery across real-time event data and streaming data. This emphatically addresses the “data in motion” challenge of enabling “business to run at the speed of data.”
- Databricks – providing the complete business context across the evolved Data Warehouse Cloud – the new Data Lakehouse platform.
- DataRobot – provides the AI, machine learning (ML), and AutoML capabilities that address the augmented intelligence requirements described at the beginning of this article.
I will finish with three quotes. The first is SAP customer testimonial from Mr. David Johnston, the Chief Information Officer at Messer Americas (leading provider of industrial and medical gases for over 120 years):
“The [Datasphere] business data fabric architecture enables us to bring SAP and non-SAP data together in the seamless and self-service way we’ve been envisioning. SAP Datasphere provided us with a solution to build a harmonized layer, or business data fabric, across SAP and non-SAP, cloud or on-premise data sources, making the best use of our existing investments [in both SAP and non-SAP data services].”
The second quote is from independent analyst Tony Baer:
“SAP’s goal is not simply pairing a data transformation factory with a data warehouse, but instead delivering a service that preserves the context of source data. As you would guess, maintaining context relies on metadata. The challenge is that when you use existing tools for replicating, moving and transforming data, the metadata typically does not usually go along with it. … SAP’s applications are a rich treasure store for business data and the process semantics that go with them. So, it’s logical that SAP has expanded on the business semantic layer of its Data Warehouse Cloud to deliver a data fabric that surfaces the metadata in business terms.”
The third quote is from Juergen Mueller, SAP Chief Technology Officer and member of the Executive Board of SAP SE:
“With SAP customers generating 87% of total global commerce, SAP data is among a company’s most valuable business assets and is contained in the most important functions of an organization, from manufacturing to supply chains, finance, human resources and more. We want to help our customers take the next step to easily and confidently integrate SAP data with non-SAP data from third-party applications and platforms, unlocking entirely new insights and knowledge to bring digital transformation to another level.”
Read, take a tour, try the free tier, deep dive, and learn more about SAP Datasphere here:
https://news.sap.com/2023/03/sap-datasphere-power-of-business-data/
Isn’t it now the time to accelerate your digital transformation efforts and get your business moving at the speed of data?
——————
This article has also been published at https://www.linkedin.com/pulse/sap-datasphere-powers-business-speed-data-kirk-borne-ph-d-/
Follow me on Twitter at @KirkDBorne