The determination of winners and losers in the data analytics space is a much more dynamic proposition than it ever has been. OneCIO said it this way, “If CIOs invested in machine learning three years ago, they would have wasted their money. But if they wait another three years, they will never catch up.” Well, that statement was made five years ago! A lot has changed in those five years, and so has the data landscape.
The dynamic changes of the business requirements and
value propositions around data analytics have been increasingly intense in
depth (in the number of applications in each business unit) and in breadth (in
the enterprise-wide scope of applications in all business units in all
sectors). But more significant has been the acceleration in the number of dynamic,
real-time data sources and corresponding dynamic, real-time analytics
applications.
We no longer should worry about “managing data at the
speed of business,” but worry more about “managing business at the speed of
data.”
One of the primary drivers for the phenomenal growth in dynamic real-time data analytics today and in the coming decade is the Internet of Things (IoT) and its sibling the Industrial IoT (IIoT). With its vast assortment of sensors and streams of data that yield digital insights in situ in almost any situation, the IoT / IIoT market has a projected market valuation of $1.5 trillion by 2030. The accompanying technology Edge Computing, through which those streaming digital insights are extracted and then served to end-users, has a projected valuation of $800 billion by 2028.
With dynamic real-time insights, this “Internet
of Everything” can then become the “Internet of Intelligent Things”, or as I
like to say, “The Internet used to be a thing. Now things are the Internet.”
The vast scope of this digital transformation in dynamic business insights
discovery from entities, events, and behaviors is on a scale that is almost
incomprehensible. Traditional business analytics approaches (on laptops, in the
cloud, or with static datasets) will not keep up with this growing tidal wave
of dynamic data.
Another dimension to this story, of course, is the Future of Work discussion, including creation of new job titles and roles, and the demise of older job titles and roles. One group has declared, “IoT companies will dominate the 2020s: Prepare your resume!” This article quotes an older market projection (from 2019), which estimated “the global industrial IoT market could reach $14.2 trillion by 2030.”
In
dynamic data-driven applications, automation of the essential processes (in
this case, data triage, insights discovery, and analytics delivery) can give a
power boost to ride that tidal wave of fast-moving data streams. One can
prepare for and improve skill readiness for these new business and career
opportunities in several ways:
Focus on the automation of business processes: e.g., artificial intelligence, robotics, robotic process automation, intelligent process automation, chatbots.
Focus on the technologies and engineering components: e.g., sensors, monitoring, cloud-to-edge, microservices, serverless, insights-as-a-service APIs, IFTTT (IF-This-Then-That) architectures.
Focus on the data science: e.g., machine learning, statistics, computer vision, natural language understanding, coding, forecasting, predictive analytics, prescriptive analytics, anomaly detection, emergent behavior discovery, model explainability, trust, ethics, model monitoring (for data drift and concept drift) in dynamic environments (MLOps, ModelOps, AIOps).
Focus on specific data types: e.g., time series, video, audio, images, streaming text (such as social media or online chat channels), network logs, supply chain tracking (e.g., RFID), inventory monitoring (SKU / UPC tracking).
Focus on the strategies that aim these tools, talents, and technologies at reaching business mission and goals: e.g., data strategy, analytics strategy, observability strategy (i.e., why and where are we deploying the data-streaming sensors, and what outcomes should they achieve?).
Insights
discovery from ubiquitous data collection (via the tens of billions of
connected devices that will be measuring, monitoring, and tracking nearly
everything internally in our business environment and contextually in the
broader market and global community) is ultimately about value creation and business
outcomes. Embedding real-time dynamic analytics at the edge, at the point of
data collection, or at the moment of need will dynamically (and positively) change
the slope of your business or career trajectory. Dynamic sense-making, insights
discovery, next-best-action response, and value creation is essential when data
is being acquired at an enormous rate. Only then can one hope to realize the
promised trillion-dollar market value of the Internet of Everything.
For more advice, check out this upcoming webinar panel discussion, sponsored by AtScale, with data and analytics leaders from Wayfair, Cardinal Health, bol.com, and Slickdeals: “How to make smarter data-driven decisions at scale.” Each panelist will share an overview of their data & analytics journey, and how they are building a self-service, data-driven culture that scales. Join us on Wednesday, March 31, 2021 (11:00am PT | 2:00pm ET). Save your spot here: http://bit.ly/3rS3ZQW. I hope that you find this event useful. And I hope to see you there!
When I was growing up, friends at school would occasionally
ask me if my older brother and I were twins. We were not, though we looked
twin-like! As I grew tired of answering that question, one day I decided to
give a more thoughtful answer to the question (beyond a simple “No”). I
replied: “Yes, we are twins. We were born 20 months apart!” My response caused
the questioner to pause and think about what I said, and perhaps reframe their
own thinking.
This story reminds me that two things may appear very much
the same, but they may be found to be not so similar after deeper inspection
and reflection. RPA and IPA are like that. Their similarities are different!
What are RPA and IPA? RPA is Robotic Process Automation, and
IPA is Intelligent Process Automation. Sound similar? Yes, in fact, their
differences are similar!
In the rest of this article, we will refer to IPA as
intelligent automation (IA), which is simply short-hand for intelligent process
automation.
Process automation is relatively clear – it refers to an
automatic implementation of a process, specifically a business process in our
case. One can automate a very complicated and time-consuming process, even for
a one-time bespoke application – the ROI must be worth it, to justify doing this
only once. Robotic Process Automation is for “more than once” automation. RPA then
refers specifically to the robotic repetition of a business process. Repetition
implies that the same steps are repeated many times, for example claims
processing or business form completion or invoice processing or invoice
submission or more data-specific activities, such as data extraction from
documents (such as PDFs), data entry, data validation, and report preparation.
The benefits of RPA accrue from its robotic repetition of a
well-defined process (specifically some sort of digital process with defined instructions,
inputs, rules, and outputs), which is to be repeated without error, thus
removing potential missteps in the process, or accidental omission of steps, or
employee fatigue. The process must be simple, stable, repetitive, and routine, and
it must be carried out the same way hundreds or thousands (or more) times. This
robotic repetition of the process assures that the steps are replicated identically,
correctly, and rapidly from one application to the next, thus yielding higher
business productivity. Consequently, as organizations everywhere are undergoing
significant digital transformation, we have been witnessing increases both in
the use of RPA in organizations and in the number of RPA products in the
market.
So, what about Intelligent Automation? IA refers to the
addition of “intelligence” to the RPA – transforming it into “smart RPA” or
even “cognitive RPA”. This is accomplished by adding more data-driven, machine
learning, and AI (artificial intelligence) components to the process discovery,
process mining, and process learning stages. IA incorporates feedback,
learning, improvement, and optimization in the automation loop. The market and
business appetite for IA is growing rapidly, particularly as more organizations
are seeking to add AI to their enterprise functions and to step up the value
derived from their process automation activities.
The pivot from RPA to IA right now has spurred Automation Anywhere, Inc. (AAI) to conduct a survey of businesses and organizations in numerous sectors and industries, to assess the current and future (Now and Next) state of RPA in the enterprise. AAI’s recently published “Now and Next State of RPA” report presents detailed results of that survey.
The AAI report covers these industries: energy/utilities,
financial/insurance, government, healthcare, industrial/manufacturing, life
sciences, retail/consumer, services/consulting, technology, telecom, and
transportation/airlines.
The first part of the report addresses the “Now” – the
present-day impact of RPA and IA – how organizations are deploying process
automation, what their priorities are, how much are they investing in it, and
what are the benefits being achieved. The “Next” part of the report probes
organizations’ forward-looking strategies and goals over the next one to two
years. Of course, both the “now” and “next” sections are affected and informed
by the COVID-19 pandemic.
Some top trends from the report include:
Cloud is becoming the platform of choice for RPA
deployments. Cloud is top of mind for leaders everywhere, and that includes
cloud migration and cloud security.
Organizations are thinking big about RPA, with
millions of bots already implemented by AAI customers. Some AAI customers have
individually deployed tens of thousands of bots.
The pandemic has rapidly increased demand for
RPA, especially in customer-facing functions, such as call centers.
Most organizations (63%) are deploying or
scaling their efforts, while 27% are still evaluating RPA solutions, and 10%
have no plans at this time.
Spending on RPA is increasing, with an estimated
doubling of the number of bots deployed in the next 12 months in most
organizations who are already actively using RPA bots.
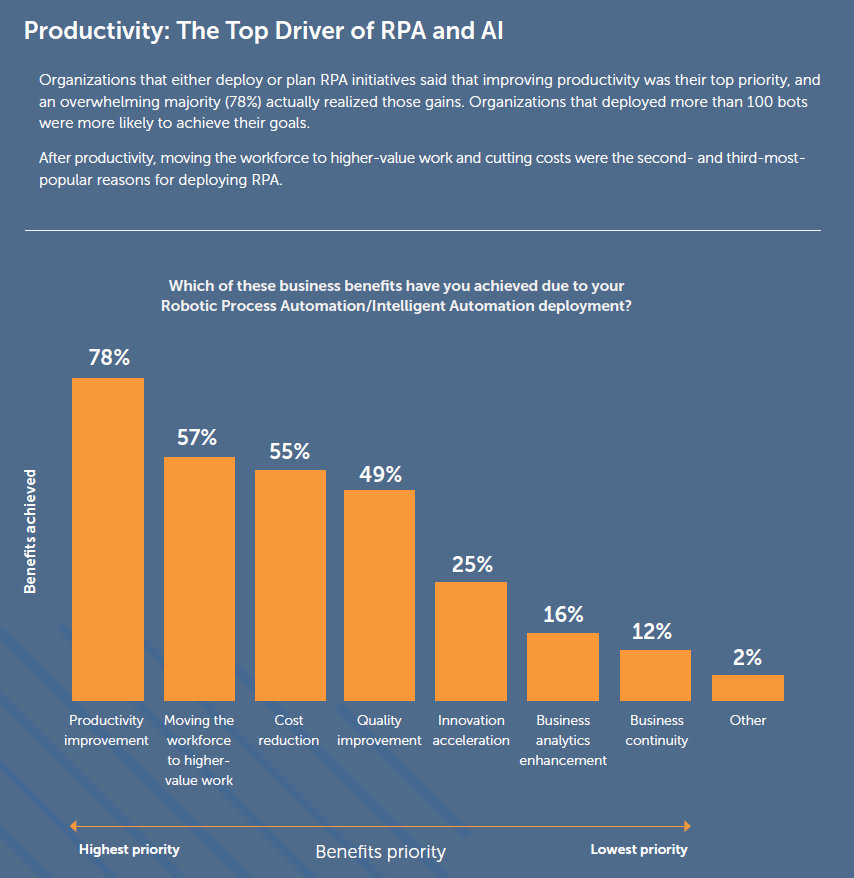
Productivity improvement is the single most
important driver for adopting RPA, IA, and AI.
The average ROI from RPA/IA deployments is 250%.
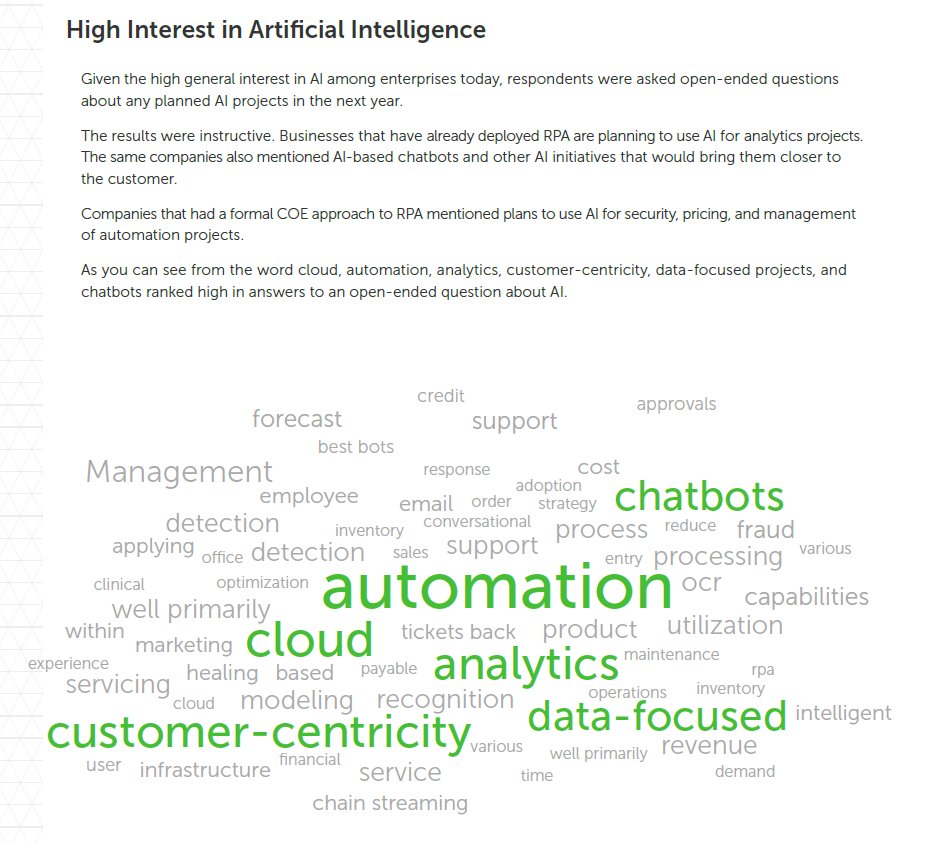
Interest in AI is high and growing, specifically
in the areas of smart analytics, customer-centricity, chatbots, and predictive
modeling. Many organizations are seeing a strong alignment of their AI and RPA
(hence, IA) projects.
The top barriers to adoption are (in order of
significance): lack of expertise, insufficient budget, lack of resources, lack
of use cases, limited ROI, organizational resistance, scalability concerns, and
security concerns.
Top use cases in the back office include finance
(general ledger data reconciliation), accounts payable (invoice processing and
payment), and HR (new employee onboarding).
Top use cases in the front office include
customer records management (including account updates), customer service
(request handling and call center support), and sales order processing.
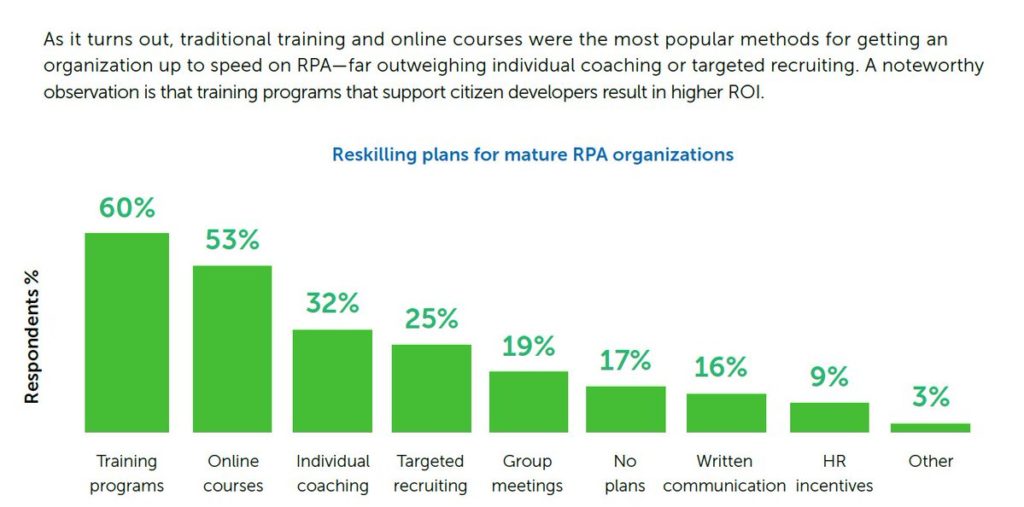
RPA education and training are on the rise
(specifically online training). This reflects the corresponding increase in
interest among many organizations in data literacy, analytics skills, AI
literacy, and AI skills training. Education initiatives address the change
management, employee reskilling, and worker upskilling that organizations are
now prioritizing.
Organizations report an increased excitement for
RPA/IA, an awareness of significant new opportunities for adoption, and a
desire for more mature RPA – that is, intelligent automation!
There are many more details, including specific insights for different sectors, in the 21-page “Now and Next State of RPA” report from Automation Anywhere, Inc. You can download the full report here: https://bit.ly/3p0IZpJ. Download it for free and learn more how the robotic twinning and repetition of business processes is the most intelligent step in accelerating digital transformation and boosting business productivity.
Productivity is the top driver of RPA and AI.Open-ended survey questions gave insights into organizations’ planned AI projects.Training initiatives are a high priority for increasing ROI from RPA and AI projects.
I recently enjoyed recording a podcast with Joe DosSantos (Chief Data Officer at Qlik). This was one in a series of #DataBrilliant podcasts by Qlik, which you can also access here (Apple Podcasts) and here (Spotify). I summarize below some of the topics that Joe and I discussed in the podcast. Be sure to listen to the full recording of our lively conversation, which covered Data Literacy, Data Strategy, Data Leadership, and more.
The Age of Hype Cycles
The data age has been marked by numerous “hype cycles.” First, we heard how Big Data, Data Science, Machine Learning (ML) and Advanced Analytics would have the honor to be the technologies that would cure cancer, end world hunger and solve the world’s biggest challenges. Then came third-generation Artificial Intelligence (AI), Blockchain and soon Quantum Computing, with each one seeking that honor.
From all this hope and hype, one constant has always been there: a focus on value creation from data. As a scientist, I have always recommended a scientific approach: State your problem first, be curious (ask questions), collect facts to address those questions (acquire data), investigate, analyze, ask more questions, include a sensible serving of skepticism, and (above all else) aim to fail fast in order to learn fast. As I discussed with Joe DosSantos when I spoke with him for the latest episode of Data Brilliant, you don’t need to be a data scientist to follow these principles. These apply to everyone, in all organizations and walks of life, in every sector.
One characteristic of science that is especially true in data science and implicit in ML is the concept of continuous learning and refining our understanding. We build models to test our understanding, but these models are not “one and done.” They are part of a cycle of learning. In ML, the learning cycle is sometimes called backpropagation, where the errors (inaccurate predictions) of our models are fed back into adjusting the model’s input parameters in a way that aims to improve the output accuracy. A more colloquial expression for this is: good judgment comes from experience, and experience comes from bad judgment.
Data Literacy For All
I know that for some, the term data and some of the other terminology I’ve mentioned already can be scary. But they shouldn’t be. We are all surrounded by – and creating – masses of data every single day. As Joe and I talked about, one of the first hurdles in data literacy is getting people to recognize that everything is data. What you see with your eyes? That’s data. What you hear with your ears? Data. The words that come out of your mouth that other people hear? That’s all data. Images, text, documents, audio, video and all the apps on your phone, all the things you search for on the internet? Yet again, that’s data.
Every single day, everyone around the world is using data and the principles I mention above, many without realizing it. So, now we need to bring this value to our businesses.
How To Build A Successful Enterprise Data Strategy
In my chat with Joe, we talked about many data concepts in the context of enterprise digital transformation. As always, but especially during the race toward digital transformation that has been accelerated by the 2020 pandemic, a successful enterprise data strategy that leads to business value creation can benefit from first addressing these six key questions:
(1) What mission objective and outcomes are you aiming to achieve?
(2) What is the business problem, expressed in data terminology? Specifically, is it a detection problem (fraud or emergent behavior), a discovery problem (new customers or new opportunities), a prediction problem (what will happen) or an optimization problem (how to improve outcomes)?
(3) Do you have the talent (key people representing diverse perspectives), tools (data technologies) and techniques (AI and ML knowledge) to make it happen?
(4) What data do you have to fuel the algorithms, the training and the modeling processes?
(5) Is your organizational culture ready for this (for data-informed decisions; an experimentation mindset; continuous learning; fail fast to learn fast; with principled AI and data governance)?
(6) What operational technology environment do you have to deploy the implementation (cloud or on-premise platform)?
Data Leadership
As Joe and I discussed, your ultimate business goal is to build a data-fueled enterprise that delivers business value from data. Therefore, ask questions, be purposeful (goal-oriented and mission-focused), be reasonable in your expectations and remain reasonably skeptical – because as famous statistician, George Box, once said “all models are wrong, but some are useful.”
Artificial intelligence (AI) has become one of the most significant emerging technologies of the past few years. Some market estimates anticipate that AI will contribute 16 trillion dollars to the global GDP (gross domestic product) by 2030. While there has been accelerating interest in implementing AI as a technology, there has been concurrent growth in interest in implementing successful AI strategies. Some key elements of such strategies that have emerged include explainable AI, trusted AI, AI ethics, operationalizing AI, scaling sustainable AI operations, workforce development (training), and how to speed up all of this development.
The 2020 year of the pandemic has forced organizations to speed up their digital transformation and advanced technology adoption plans, essentially compressing several years of anticipated developments into several months. These accelerated developments cover a wide scope, including: technology-enabled remote work solutions, technology-enhanced health and safety programs, AI-powered implementations of “all of the above”, and sharpened focus and attention on their workforce: future of work in the age of AI, AI-assisted human work and process enhancements, and training initiatives (including data literacy and AI).
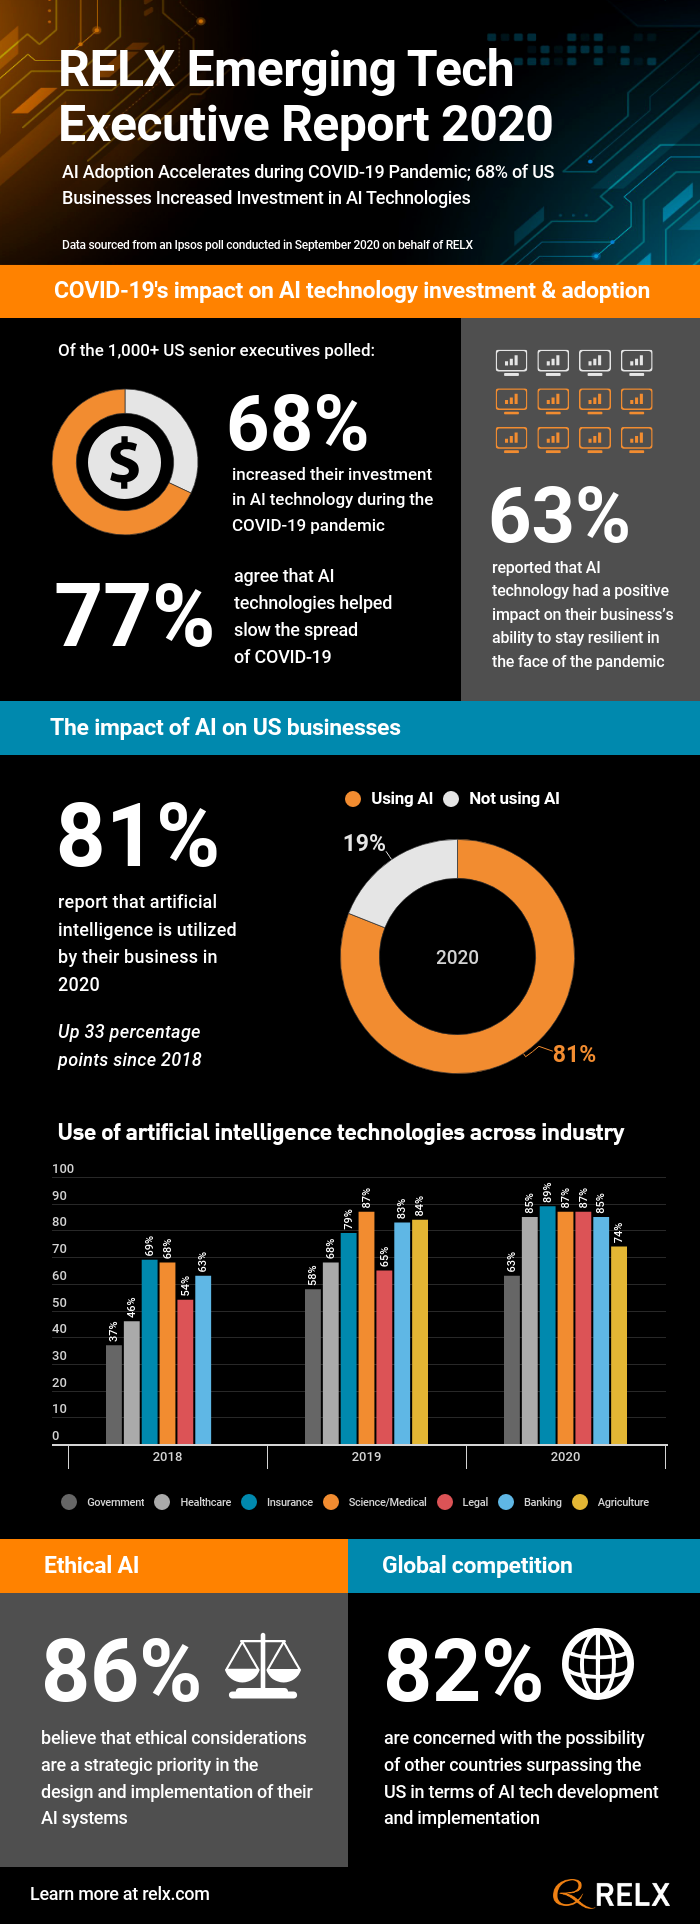
In the recent 2020 RELX Emerging Tech Study, results were presented from a survey of over 1000 U.S. senior executives across eight industries: agriculture, banking, exhibitions, government, healthcare, insurance, legal, and science/medical. The survey, carried out by RELX (a global provider of information-based analytics and decision tools for professional and business customers), focused on the state of interest, investment, and implementations in AI tech during the pandemic period. But it was not just a snapshot on the state of AI in 2020. The survey also had forward-looking questions, as well as historical comparisons and trends from results of similar “state of AI in the enterprise” surveys in 2018 and 2019.
Some of the most remarkable findings in the 3-year trending data include these changes from 2018 to 2020:
1) The percentage of senior executives who stated that AI technologies are being utilized in their business dramatically increased from 48% to 81%.
2) The percentage who are concerned about other countries being more advanced than the U.S. in AI technology and implementation increased from 70% to 82%.
3) The percentage who believe that government programs should assist in AI workforce development increased from 45% to 59%.
4) There was a slight increase (though still a minority) in those who believe that the government should leave the promotion of AI technologies to the private sector, growing from 30% to 36%.
5) There is a continued (and growing) strong belief that U.S. companies should invest in the future AI workforce through educational initiatives such as university partnerships, increasing from 92% to 95%.
6) The percentage who are offering training opportunities in AI technologies to their workforce increased significantly from 46% to 75%.
Some of the interesting findings specifically in the 2020 survey results include:
1) Across all sectors, a strong majority (86%) of survey respondents believe that ethical considerations are a strategic priority in the design and implementation of their AI systems, ranging from 77% in government and 80% in the legal sectors, up to 93% in banking and 94% in the insurance sectors, with healthcare and science/medical near the middle of that range.
2) The majority (68%) of respondents stated that they increased their investment in AI technologies, 48% of which invested in new AI technologies. The sectors with the greatest increases in investment were insurance, banking, and agriculture, followed closely by healthcare and science/medical.
3) 82% stated that AI technologies are most likely to be used to increase efficiencies and worker productivities.
4) Only 26% of respondents reported that AI technologies are being used to replace human labor.
Regarding the last point, this minority view regarding AI’s potential negative impact on employment is consistent with a 2019 worldwide survey of 19,000 employers, which found that 87% plan to increase or maintain the size of their staff as a result of automation and AI, and that just 9% of companies across the globe and 4% in the U.S. anticipate cutting jobs. Another report stated, “Rather, than being replaced, humans will be redeployed into higher-order jobs requiring more cognitive skills.”
(a) COVID-19 drove increased AI tech investment and adoption.
(b) The use of AI has increased across all sectors that were polled.
(c) Ethical AI is viewed as both a priority and a competitive advantage.
(d) International competition remains a concern for U.S. organizations.
(e) AI workforce training and development is a major component of AI strategy, though AI implementations consistently outpace training initiatives.
Vijay Raghavan, Executive Vice President and Chief Technology Officer for the Risk & Business Analytics division of RELX, has summarized the survey results very well in the following statements:
“Businesses’ response to COVID-19 has confirmed the view of US business leaders that artificial intelligence has the power to create smarter, more agile and profitable businesses.”
“Businesses face more complex challenges every day and AI technologies have become a mission-critical resource in adapting to, if not overcoming, these types of unforeseen obstacles and staying resilient.”
“Companies that do not dedicate the necessary resources to training existing employees on new AI technologies risk leaving growth opportunities on the table and using biased or otherwise flawed systems to make and enforce major decisions.”
Therefore, when we consider AI strategy, a global perspective is no less important than local organization-specific mission objectives. Understanding your competition, the marketplace, and both the current expectations and future needs of your stakeholders (customers, employees, citizens, and shareholders) is vital. Furthermore, non-technology considerations should be incorporated alongside technology implementation and operationalization requirements. Performance metrics and goals associated with AI governance, ethics, talent, and training must be on the same balance sheet as AI tools, techniques, and technologies. How to bring all of these pieces together in a successful AI strategy has become clearer with the results and insights revealed in the 2020 RELX Emerging Tech survey.
I have written articles in many places. I will be collecting links to those sources here. The list is not complete and will be constantly evolving. There are some older blogs that I will be including in the list below as I remember them and find them. Also included are some interviews in which I provided detailed answers to a variety of questions.
And then there’s this — not a blog, but a link to my 2013 TedX talk: “Big Data, Small World.” (Many more videos of my talks are available online. That list will be compiled in another place soon.)
In 2019, I was asked to write the Foreword for the book “Graph Algorithms: Practical Examples in Apache Spark and Neo4j“, by Mark Needham and Amy E. Hodler. I wrote an extensive piece on the power of graph databases, linked data, graph algorithms, and various significant graph analytics applications. In their wisdom, the editors of the book decided that I wrote “too much”. So, they correctly shortened my contribution by about half in the final published version of my Foreword for the book.
The book is awesome, an absolute must-have reference volume, and it is free (for now, downloadable from Neo4j).
Graph Algorithms book
Now, for the first time, the full unabridged (and unedited) version of my initial contribution as the Foreword for the book is published here. (You should still get the book because it is a fantastic 250-page masterpiece for data scientists!) Any omissions, errors, or viewpoints in the piece below are entirely my own. I publish this in its original form in order to capture the essence of my point of view on the power of graph analytics.
As you read this, just remember the most important message: the natural data structure of the world is not rows and columns, but a graph. And this: perhaps the most powerful node in a graph model for real-world use cases might be “context”. How does one express “context” in a data model? Ahh, that’s the topic for another article. But this might help you get there: https://twitter.com/KirkDBorne/status/1232094501537275904
“All the World’s a Graph”
What do marketing attribution analysis, anti-money laundering, customer journey modeling, safety incident causal factor analysis, literature-based discovery, fraud network analysis, Internet search, the map app on your mobile phone, the spread of infectious diseases, and the theatrical performance of a William Shakespeare play all have in common? No, it is not something as trivial as the fact that all these phrases contain nouns and action verbs! What they have in common is that all these phrases proved that Shakespeare was right when he declared, “All the world’s a graph!”
Okay, the Bard of Avon did not actually say “Graph” in that sentence, but he did say “Stage” in the sentence. However, notice that all the examples mentioned above involve entities and the relationships between them, including both direct and indirect (transitive) relationships — a graph! Entities are the nodes in the graph — these can be people, events, objects, concepts, or places. The relationships between the nodes are the edges in the graph. Therefore, isn’t the very essence of a Shakespearean play the live action portrayal of entities (the nodes) and their relationships (the edges)? Consequently, maybe Shakespeare could have said “Graph” in his famous declaration.
What makes graph algorithms and graph
databases so interesting and powerful isn’t the simple relationship between two
entities: A is related to B. After all, the standard relational model of
databases instantiated these types of relationships in its very foundation
decades ago: the ERD (Entity-Relationship Diagram). What makes graphs so
remarkably different and important are directional relationships and transitive
relationships. In directional relationships, A may cause B, but not the
opposite. In transitive relationships, A can be directly related to B and B can
be directly related to C, while A is not directly related to C, so that
consequently A is transitively related to C.
Because of transitivity relationships, particularly
when they are numerous and diverse with many possible relationship (network)
patterns and many possible degrees of separation between the entities, the
graph model enables discovery of relationships between two entities that
otherwise may seem wholly disconnected, unrelated, and difficult (if not
impossible) to discover in a relational database. Hence, the graph model can be
applied productively and effectively in numerous network analysis use cases.
Consider this marketing attribution use case:
person A sees the marketing campaign, person A talks about it on their social
media account, person B is connected to person A and sees the comment, and
subsequently person B buys the product. From the marketing campaign manager’s
perspective, the standard relational model would fail to identify the
attribution, since B did not see the campaign and A did not respond to the
campaign. The campaign looks like a failure. But it is not a failure — its
actual success (and positive ROI) is discovered by the graph analytics
algorithm through the transitive relationship between the marketing campaign
and the final customer purchase, through an intermediary
(entity-in-the-middle)!
Next, consider the anti-money laundering (AML) use case: person A and person C are under suspicion for illicit trafficking. Any interaction between the two (e.g., a financial transaction in a financial database) would be flagged by the authorities, and the interactions would come under great scrutiny. However, if A and C never transact any business together, but instead conduct their financial dealings through a safe, respected, unflagged financial authority B, then who would ever notice the transaction? Well, the graph analytics algorithm would notice! The graph engine would discover that there was a transitive relationship between A and C through the intermediary B (the entity-in-the-middle).
Similar descriptions of the power of graph can be given for the other use cases mentioned in the opening paragraph above, all of which are examples of network analysis through graph algorithms. Each of those cases deeply involves entities (people, objects, events, actions, concepts, and places) and their relationships (touch points, both causal and simple associations). Because of their great interest and power, we highlight two more of those use cases: Internet search and Literature-Based Discovery (LBD).
In Internet search a hyperlinked network
(graph-based) algorithm is used by a major search engine to find the central
authoritative node across the entire Internet for any given set of search
words. The directionality of the edge is most important in this use case since
the authoritative node in the network is the one that many other nodes point
toward.
LBD is a knowledge network (graph-based)
application in which significant discoveries are enabled across the
knowledgebase of thousands (and even millions) of research journal articles —
the discovery of “hidden knowledge” is only made through the connection between
two published research results that may have a large number of degrees of
separation (transitive relationships) between them. LBD is being applied to
cancer research studies, where the massive semantic medical knowledgebase of
symptoms, diagnoses, treatments, drug interactions, genetic markers, short-term
results, and long-term consequences may be “hiding” previously unknown cures or
beneficial treatments of the most impenetrable cases. The knowledge is already
in the network, if only we were to connect the dots to discover it.
The book Graph Algorithms: Practical Examples in Apache Spark and Neo4j is aimed at broadening our knowledge and capabilities around these types of graph analyses, including algorithms, concepts, and practical machine learning applications of the algorithms. From basic concepts to fundamental algorithms, to processing platforms and practical use cases, the authors have compiled an instructive and illustrative guide to the wonderful world of graphs.
Chapter 1 provides a beautiful introduction to
graphs, graph analytics algorithms, network science, and graph analytics use
cases. In the discussion of power-law distributions, we see again another way
that graphs differ from more familiar statistical analyses that assume a normal
distribution of properties in random populations. Prepare yourself for some
unexpected insights when you realize that power-law distributions are
incredibly common in the natural world — graph analytics is a great tool for
exploring those scale-free structures and their long tails. By the way, I
always love a discussion that mentions the Pareto distribution.
Chapter 2 steps up our graph immersion by
introducing us to the many different types of graphs that represent the rich
variety of informative relationships that can exist between nodes, including
directed and undirected, cyclic and acyclic, trees, and more. If you have
always wondered what a DAG was, now you have no more excuses for not knowing.
It’s all here. The chapter ends with a quick summary of things to come in
greater detail in future chapters, by defining the three major categories of
graph algorithms: pathfinding, centrality, and community detection.
Chapter 3 focuses on the graph processing platforms that are mentioned in the subtitle to the book: Apache Spark and Neo4j. In the Apache Spark section, you will find information about the Spark Graph Project, GraphFrames, and Cypher (the graph query language). In the Neo4j section, you will learn about its APOC library: Awesome Procedures On Cypher. Brief instructions on installing these graph engines are included, to prepare you for the use cases and sample applications that are provided later in the book.
Chapters 4, 5, and 6 then dive into the three
major graph algorithm categories mentioned earlier. For example, the map app on
your mobile phone employs a version of the pathfinding algorithm.
Root cause analysis, customer journey modeling, and the spread of infectious
diseases are other example applications of pathfinding.
Internet search and influencer detection in social networks are example
applications of the centrality algorithm.
Fraud network analysis, AML, and LBD are example applications of community detection.
Marketing attribution is a use case that may
productively incorporate applications of all three graph analytics algorithm
categories, depending on the specific question being asked: (1) how did the
marketing message flow from source to final action? (pathfinding);
(2) was there a dominant influencer who initiated the most ROI from the
marketing campaign? (centrality); or (3) is there a
community (a set of common personas) that are most responsive to the marketing
campaign? (community detection).
Let’s not forget one more example application
— a well-conceived theatrical masterpiece will almost certainly be an
instantiation of community detection (co-conspirators,
love triangles, and all that). That masterpiece will undoubtedly include a
major villain or a central hero (representing centrality). Such a
masterpiece is probably also a saga (the story of a journey), containing
intrigues, strategies, and plots that move ingeniously, methodically, and
economically (in three acts or less) toward some climactic ending (thus
representing pathfinding).
In Chapter 7, we find many code samples for
example applications of graph algorithms, thus rendering all the above
knowledge real and useful to the reader. In this manner, the book becomes an
instructional tutorial as well as a guide on the side. Putting graph algorithms
into practice through these examples is one of the most brilliant contributions
of this book — giving you the capability to do it for yourself and to start
reaping the rewards of exploring the most natural data structure to describe
the world: not rows and columns, but a graph! You will be able to connect the
dots that aren’t connected in traditional data structures, build a knowledge
graph, explore the graph for insights, and exploit it for value. Let’s put this
another way: your graph-powered team will be able to increase the value of your
organization’s data assets in ways that others may not have ever imagined. Your
team will become graph heroes.
Finally, in Chapter 8, the connection between
graph algorithms and machine learning that was implicit throughout the book now
becomes explicit. The training data and feature sets that feed machine learning
algorithms can now be immensely enriched with tags, labels, annotations, and
metadata that were inferred and/or provided naturally through the
transformation of your repository of data into a graph of data. Any node and
its relationship to a particular node becomes a type of contextual metadata for
that particular note. All of that “metadata” (which is simply “other data about
your data”) enables rich discovery of shortest paths, central nodes, and
communities.
Graph modeling of your data set thus enables
more efficient and effective feature extraction and selection (also described
in Chapter 8), as the graph exposes the most important, influential,
representative, and explanatory attributes to be included in machine learning
models that aim to predict a particular target outcome variable as accurately
as possible.
When considering the power of graph, we should
keep in mind that perhaps the most powerful node in a graph model for
real-world use cases might be “context”, including the contextual metadata that
we already mentioned. Context may include time, location, related events,
nearby entities, and more. Incorporating context into the graph (as nodes and
as edges) can thus yield impressive predictive analytics and prescriptive
analytics capabilities.
When all these pieces and capabilities are brought together, the graph analytics engine is thereby capable of exploring deep relationships between events, actions, people, and other things across both spatial and temporal (as well as other contextual) dimensions. Consequently, a graph algorithm-powered analysis tool may be called a Spatial-Temporal Analytics Graph Engine (STAGE!). Therefore, if Shakespeare was alive today, maybe he would agree with that logic and would still say “All the world’s a STAGE.” In any case, he would want to read this book to learn how to enrich his stories with deeper insights into the world and with more interesting relationships.
Definitions of terminology frequently seen and used in discussions of emerging digital technologies.
Additive Manufacturing: see 3D-Printing
AGI (Artificial General Intelligence): The intelligence of a machine that has the capacity to understand or learn any intellectual task that a human being can. It is a primary goal of some artificial intelligence research and a common topic in science fiction and future studies.
AI (Artificial Intelligence): Application of Machine Learning algorithms to robotics and machines (including bots), focused on taking actions based on sensory inputs (data). Examples: (1-3) All those applications shown in the definition of Machine Learning. (4) Credit Card Fraud Alerts. (5) Chatbots (Conversational AI). There is nothing “artificial” about the applications of AI, whose tangible benefits include Accelerated Intelligence, Actionable Intelligence (and Actionable Insights), Adaptable Intelligence, Amplified Intelligence, Applied Intelligence, Assisted Intelligence, and Augmented Intelligence.
Algorithm: A set of rules to follow to solve a problem or to decide on a particular action (e.g., the thermostat in your house, or your car engine alert light, or a disease diagnosis, or the compound interest growth formula, or assigning the final course grade for a student).
Analytics: The products of Machine Learning and Data Science (such as predictive analytics, health analytics, cyber analytics).
AR (Augmented Reality): A technology that superimposes a computer-generated image on a user’s view of the real world, thus providing a composite view. Examples: (1) Retail. (2) Disaster Response. (3) Machine maintenance. (4) Medical procedures. (5) Video games in your real world. (6) Clothes shopping & fitting (seeing the clothes on you without a dressing room). (7) Security (airports, shopping malls, entertainment & sport events).
Autonomous Vehicles: Self-driving (guided without a human), informed by data streaming from many sensors (cameras, radar, LIDAR), and makes decisions and actions based on computer vision algorithms (ML and AI models for people, things, traffic signs,…). Examples: Cars, Trucks, Taxis
BI (Business Intelligence): Technologies, applications and practices for the collection, integration, analysis, and presentation of business information. The purpose of Business Intelligence is to support better business decision-making.
Big Data: An expression that refers to the current era in which nearly everything is now being quantified and tracked (i.e., data-fied). This leads to the collection of data and information on nearly full-population samples of things, instead of “representative subsamples”. There have been many descriptions of the characteristics of “Big Data”, but the three dominant attributes are Volume, Velocity, and Variety — the “3 V’s” concept was first introduced by Doug Laney in 2001 here. Read more in this article: “Why Today’s Big Data is Not Yesterday’s Big Data“. Some consider the 2011 McKinsey & Company research report “Big Data: The Next Frontier for Innovation, Competition, and Productivity” as the trigger point when the world really started paying attention to the the volume and variety of data that organizations everywhere are collecting — the report stated, “The United States alone could face a shortage of 140,000 to 190,000 people with deep analytical skills as well as 1.5 million managers and analysts with the know-how to use the analysis of big data to make effective decisions.”
Blockchain: A system in which a permanent and verifiable record of transactions is maintained across several computers that are linked in a peer-to-peer network. It has many applications beyond its original uses for bitcoin and other cryptocurrencies. Blockchain in an example of Distributed Ledger Technology, in which independent computers (referred to as nodes) record, share and synchronize transactions in their respective electronic ledgers (instead of keeping data centralized as in a traditional ledger). Blockchain’s name refers to a chain (growing list) of records, called blocks, which are linked using cryptography, and are used to record transactions between two parties efficiently and in a verifiable and permanent way. In simplest terms, Blockchain is a distributed database existing on multiple computers at the same time. It grows as new sets of recordings, or ‘blocks’, are added to it, forming a chain. The database is not managed by any particular body; instead, everyone in the network gets a copy of the whole database. Old blocks are preserved forever and new blocks are added to the ledger irreversibly, making it impossible to manipulate by faking documents, transactions and other information. All blocks are encrypted in a special way, so everyone can have access to all the information but only a user who owns a special cryptographic key is able to add a new record to a particular chain.
Chatbots (see also Virtual Assistants): These typically are text-based user interfaces (often customer-facing for organizations) that are designed and programmed to reply to only a certain set of questions or statements. If the question asked is other than the learned set of responses by the customer, the chatbot will fail. Chatbots cannot hold long, continuing human interaction. Traditionally they are text-based but audio and pictures can also be used for interaction. They provide more like an FAQ (Frequently Asked Questions) type of an interaction. They cannot process language inputs generally.
Cloud: The cloud is a metaphor for a global network of remote servers that operates transparently to the user as a single computing ecosystem, commonly associated with Internet-based computing.
Cloud Computing: The practice of using a network of remote servers hosted on the Internet to store, manage, and process data, rather than a local server, local mainframe, or a personal computer.
Computer Vision: An interdisciplinary scientific field that focuses on how computers can be made to gain high-level understanding from digital images or videos. From the perspective of engineering, it seeks to automate tasks that the human visual system can do, including pattern detection, pattern recognition, pattern interpretation, and pattern classification.
Data Mining: Application of Machine Learning algorithms to large data collections, focused on pattern discovery and knowledge discovery in data. Pattern discovery includes clusters (class discovery), correlation (and trend) discovery, link (association) discovery, and anomaly detection (outlier detection, surprise discovery).
Data Science: Application of scientific method to discovery from data (including Statistics, Machine Learning, data visualization, exploratory data analysis, experimentation, and more).
Digital Transformation: Refers to the novel use of digital technology to solve traditional problems. These digital solutions enable — other than efficiency via automation — new types of innovation and creativity, rather than simply enhance and support traditional methods.
Digital Twins: A phrase used to describe a computerized (or digital) version of a real physical asset and/or process. The digital twin contains one or more sensors that collects data to represent real-time information about the physical asset. By bridging the physical and the virtual world, data is transmitted seamlessly allowing the virtual entity to exist simultaneously with the physical entity. Digital Twins are used in manufacturing, large-scale systems (such as maritime vessels, wind farms, space probes) and other complex systems. Digital Twins are virtual replicas of physical devices that data scientists and IT pros can use to run simulations before actual devices are built and deployed, and also while those devices are in operation. They represent a strong merging and optimization of numerous digital technologies such as IoT (IIoT), AI, Machine Learning, and Big Data Analytics.
Drone (UAV, UAS): An unmanned aerial vehicle (UAV) or uncrewed aerial vehicle (commonly known as a Drone) is an aircraft without a human pilot on board. UAVs are a component of an unmanned aircraft system (UAS); which include a UAV, a ground-based controller, and a system of communications between the two.
Dynamic Data-driven Application (Autonomous) Systems (DDDAS): A paradigm in which the computation and instrumentation aspects of an application system are dynamically integrated in a feed-back control loop, such that instrumentation data can be dynamically incorporated into the executing model of the application, and in reverse the executing model can control the instrumentation. Such approaches can enable more accurate and faster modeling and analysis of the characteristics and behaviors of a system and can exploit data in intelligent ways to convert them to new capabilities, including decision support systems with the accuracy of full scale modeling, efficient data collection, management, and data mining. See http://dddas.org/.
Edge Computing (and Edge Analytics): A distributed computing paradigm which brings computation to the data, closer to the location where it is needed, to improve response times in autonomous systems and to save bandwidth. Edge Analytics specifically refers to an approach to data collection and analysis in which an automated analytical computation is performed on data at a sensor, network switch or other device instead of waiting for the data to be sent back to a centralized data store. This is important in applications where the result of the analytic computation is needed as fast as possible (at the point of data collection), such as in autonomous vehicles or in digital manufacturing.
Industry 4.0: A reference to a new phase in the Industrial Revolution that focuses heavily on interconnectivity, automation, Machine Learning, and real-time data. Industry 4.0 is also sometimes referred to as IIoT (Industrial Internet of Things) or Smart Manufacturing, because it joins physical production and operations with smart digital technology, Machine Learning, and Big Data to create a more holistic and better connected ecosystem for companies that focus on manufacturing and supply chain management.
IoT (Internet of Things) and IIoT (Industrial IoT): Sensors embedded on devices and within things everywhere, measuring properties of things, and sharing that data over the Internet (over fast 5G), to fuel ML models and AI applications (including AR and VR) and to inform actions (robotics, autonomous vehicles, etc.). Examples: (1) Wearable health devices (Fitbit). (2) Connected cars. (3) Connected products. (4) Precision farming. (5) Industry 4.0
Knowledge Graphs (see also Linked Data): Knowledge graphs encode knowledge arranged in a network of nodes (entities) and links (edges) rather than tables of rows and columns. The graph can be used to link units of data (the nodes, including concepts and content), with a link (the edge) that explicitly specifies what type of relationship connects the nodes.
Linked Data (see also Knowledge Graphs): A data structure in which data items are interlinked with other data items that enables the entire data set to be more useful through semantic queries. The easiest and most powerful standard designed for Linked Data is RDF (Resource Description Framework).
Machine Learning (ML): Mathematical algorithms that learn from experience (i.e., pattern detection and pattern recognition in data). Examples: (1) Digit detection algorithm (used in automated Zip Code readers at Post Office. (2) Email Spam detection algorithm (used for Spam filtering). (3) Cancer detection algorithm (used in medical imaging diagnosis).
MR (Mixed Reality): Sometimes referred to as hybrid reality, is the merging of real and virtual worlds to produce new environments and visualizations where physical and digital objects co-exist and interact in real time. It means placing new imagery within a real space in such a way that the new imagery is able to interact, to an extent, with what is real in the physical world we know. The key characteristic of MR is that the synthetic content and the real-world content are able to react to each other in real time.
NLP (Natural Language Processing), NLG (NL Generation), NLU (NL Understanding): NLP a subfield of computer science, information engineering, and artificial intelligence concerned with the interactions between computers and human languages, in particular how to program computers to process and analyze large amounts of natural language data. NLG is a software process that transforms structured data into human-language content. It can be used to produce long form content for organizations to automate custom reports, as well as produce custom content for a web or mobile application, or produce the words that will be spoken by a Virtual (Voice-based) Assistant. NLU is a subtopic of Natural Language Processing in Artificial Intelligence that deals with algorithms that have language comprehension (understanding the meaning of the words, both their content and their context).
Quantum Computing: The area of study focused on developing computer technology based on the principles of quantum theory and quantum phenomena (such as superposition of states and entanglement). Qubits are the fundamental units of quantum computing — they are somewhat analogous to bits in a classical computer.
Robotics: A branch of AI concerned with creating devices that can move and react to sensory input (data). Examples: (1) Automated manufacturing assembly line. (2) Roomba (vacuums your house). (3) Warehouse / Logistics. (4) Prosthetics.
Statistics: the practice or science of collecting and analyzing numerical data, especially for the purpose of inferring proportions in a whole population from measurements of those properties within a representative subsample.
UAV (Unmanned Aerial Vehicle) and UAS (Unmanned Aircraft System): see Drones.
Virtual Assistants (see also Chatbots): A sophisticated voice-based interface in an interactive platform for user and customer interactions. Virtual assistants understand not only the language but also the meaning of what the user is saying. They can learn from their conversation instances, which can lead to an unpredictability in their behavior. Consequently, they can have extended adaptable human interaction. They can be set to perform slightly complicated tasks as well, such as order-taking and task fulfillment.
VR (Virtual Reality): Computer-generated simulation of a three-dimensional environment that can be interacted with in a seemingly real or physical way by a person using special electronic equipment, such as a helmet with a screen inside or gloves fitted with sensors. Examples: (1) Games. (2) Family adventures. (3) Training & Education. (4) Design. (5) Big Data Exploration.
XAI (eXplainable AI, Trusted AI): Artificial intelligence that is programmed to describe (explain) its purpose, rationale and decision-making process in a way that can be understood by the average person. This includes the specific criteria the program uses to arrive at a decision.
XPU: One of the many specialized CPUs for specific applications (similar to an ASIC), which may be real-time, data-intensive, data-specific, or at the edge (see Edge Analytics). For more information, refer to the article “Sensor Analytics at Micro Scale on the xPU“.
3D-Printing … moving on to 4D-printing: Additive Manufacturing — the action or process of making a physical object from a three-dimensional digital model, typically by laying down many thin layers of a material in succession. The terms “additive manufacturing” and “3D printing” both refer to creating an object by sequentially adding build material in successive cross-sections, one stacked upon another.
5G: Fifth-generation wireless, the latest iteration of cellular technology, engineered to greatly increase the speed and responsiveness of wireless networks. 5G will also enable a sharp increase in the amount of data transmitted over wireless systems due to more available bandwidth. Example applications: (1) High-definition and 3D video. (2) Gbit/sec Internet. (3) Broadband network access nearly everywhere. (4) IoT.
A few years ago, I generated a list of places to receive data science training. That list has become a bit stale. So, I have updated the list, adding some new opportunities, keeping many of the previous ones, and removing the obsolete ones.
Diversity in data is one of the three defining characteristics of big data — high data variety — along with high data volume and high velocity. We discussed the power and value of high-variety data in a previous article: “The Five Important D’s of Big Data Variety” We won’t repeat those lessons here, but we focus specifically on the bias-busting power of high-variety data, which was actually the last of the five D’s mentioned in the earlier article: Decreased model bias.
Here, we broaden our meaning of “bias” to go beyond model bias, which has the technical statistical meaning of “underfitting”, which essentially means that there is more information and structure in the data than our model has captured. In the current context, we apply a broader definition of bias: lacking a neutral viewpoint, or having a viewpoint that is partial. We will call this natural bias, since the examples can be considered as “naturally occurring” without obvious intent. This article does not elaborate on personal bias (which might be intentional), though the cause for that kind of prejudice is essentially the same: not considering and taking into account the full knowledge and understanding of the person or entity that is the subject of the bias.
In that full version of this article, we go on to describe several examples of natural bias and then to present a recommended bias-busting remedy for those of us working in the realm of data science. We refer to that remedy as the CCDI data & analytics strategy: Collect, Curate, Differentiate, and Innovate.
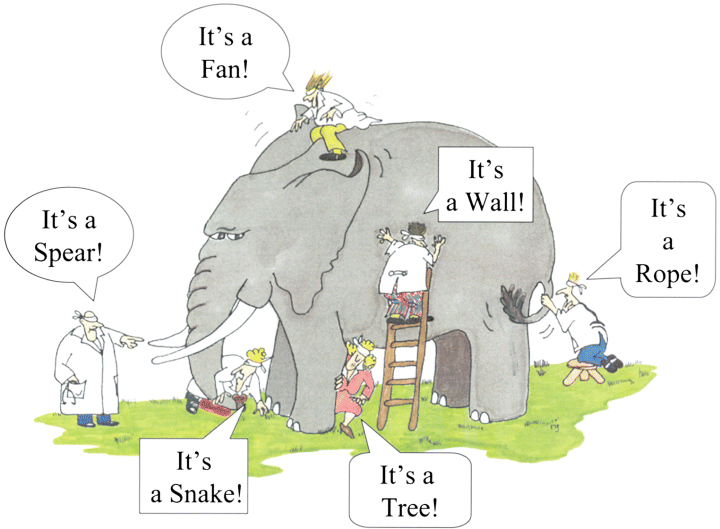
Here is one of the four examples of natural bias that you will find in the longer, complete version of the article:
An example of natural bias comes from a famous cartoon. The cartoon shows three or more blind men (or blindfolded men) feeling an elephant. They each feel a different aspect of the elephant: the tail, a tusk, an ear, the body, a leg — and consequently they each offer a different interpretation of what they believe this thing is (which they cannot see). They say it might be a rope (the tail), or a spear (the tusk), or a large fan (the ear), or a wall (the body), or a tree trunk (the leg). Only after the blindfolds are removed (or an explanation is given) do they finally “see” the full truth of this large complex reality. It has many different features, facets, and characteristics. Focusing on only one of those features and insisting that this partial view describes the whole thing would be foolish. We have similar complex systems in our organizations, whether it is the human body (in healthcare), or our population of customers (in marketing), or the Earth (in climate science), or different components in a complex system (like a manufacturing facility), or our students (in a classroom), or whatever. Unless we break down the silos and start sharing our data (insights) about all the dimensions, viewpoints, and perspectives of our complex system, we will consequently be drawn into biased conclusions and actions, and thus miss the key insights that enable us to understand the wonderful complexity and diversity of the thing in its entirety. Integrating the many data sources enables us to arrive at the “single correct view” of the thing: the 360 view!
Collecting high-variety data from diverse sources, connecting the dots, and building the 360 view of our domain is not only the data silo-busting thing to do. It is also the bias-busting thing to do. High-variety data makes that possible, and there is no shortage of biases for high-variety data to bust, including cognitive bias, confirmation bias, salience bias, and sampling bias, just to name a few! …