Recent top-selling books in AI and Machine Learning

Top Books in AI and Machine Learning

Top Books in AI and Machine Learning

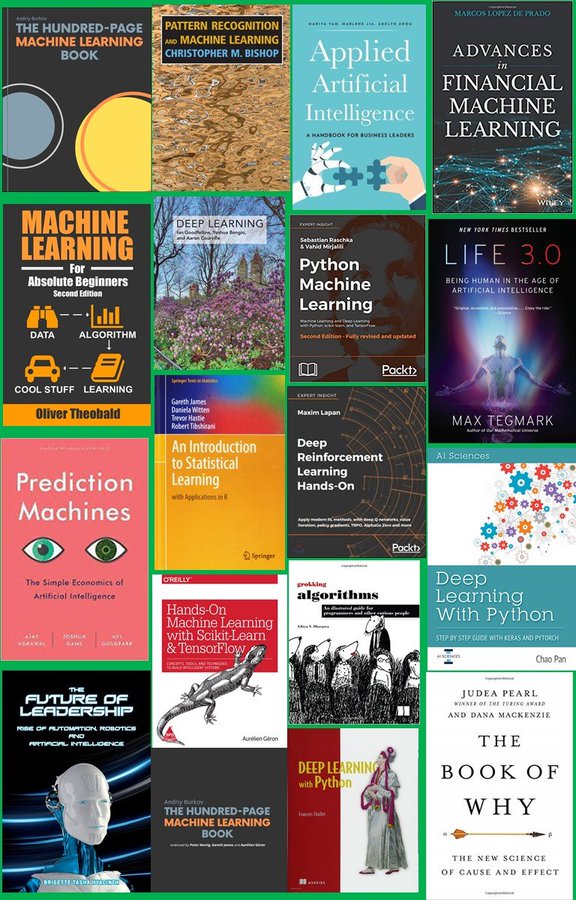
Below are the individual links to these Data Science, Artificial Intelligence and Machine Learning books, all of which are top sellers…

“The Hundred-Page Machine Learning Book”

“The Book of Why: The New Science of Cause and Effect”

“Hands-On Machine Learning with Scikit-Learn and TensorFlow: Concepts, Tools, and Techniques to Build Intelligent Systems”

“Deep Learning (Adaptive Computation and Machine Learning)”

“Applied Artificial Intelligence: A Handbook For Business Leaders”

“Machine Learning For Absolute Beginners: A Plain English Introduction”

“Life 3.0: Being Human in the Age of Artificial Intelligence”

“An Introduction to Statistical Learning: with Applications in R” (7th printing; 2017 edition)

“Grokking Algorithms: An illustrated guide for programmers and other curious people”

“Prediction Machines: The Simple Economics of Artificial Intelligence”

“Deep Learning with Python”

“Python Machine Learning” (2nd edition)

“Advances in Financial Machine Learning”

“The Future of Leadership: Rise of Automation, Robotics and Artificial Intelligence”

“Deep Learning With Python: Step By Step Guide With Keras and Pytorch”

“Deep Reinforcement Learning Hands-On”

“Pattern Recognition and Machine Learning”


Disclosure statement: As an Amazon Associate I earn from qualifying purchases.

Machine Learning Making Big Moves in Marketing

Machine Learning is (or should be) a core component of any marketing program now, especially in digital marketing campaigns. The following insightful quote by Dan Olley (EVP of Product Development and CTO at Elsevier) sums up the urgency and criticality of the situation: “If CIOs invested in machine learning three years ago, they would have wasted their money. But if they wait another three years, they will never catch up.” This statement also applies to CMOs.

To illustrate and to motivate these emerging and growing developments in marketing, we list here some of the top Machine Learning trends that we see:

  1. Hyper-personalization (SegOne context-driven marketing)
  2. Real-time sentiment analysis and response (social customer care)
  3. Behavioral analytics (predictive and prescriptive)
  4. Conversational chatbots (using NLG: Natural Language Generation)
  5. Agile analytics (DataOps)
  6. Influencer marketing (amplification of your message to specific audiences)
  7. Journey Sciences (using graph and linked data modeling)
  8. Context-based customer engagement through IoT (knowing the knowable via ubiquitous sensors)

You can read more details about each of these developments in my MapR blog.

And check out the excellent resources and services (in Data Analytics, Data Science, Machine Learning, AI, and Operations Research) at DataPrime Inc., to help all of your data-driven campaigns make big moves and move forward more effectively.

Four Ways to Harness Big Data in the Energy Sector

The big change in every industry – energy included – is the sensoring of the world. We have put sensors on just about everything, and that’s definitely true in the energy sector, whether it’s in electricity, oil and gas, supply chain and manufacturing, or even customer interaction.

We call that big data, which people sometimes take to mean as big volume, but I like to think of as big value. Because with all this information, we can understand how our systems work – and put them to better use to create greater value for our business.

Prescriptive models

There is greater insight than ever before into how energy is distributed, both in the course of the day and across specific locations. In NASA, we tracked potential ‘killer asteroids’ – asteroids that have the potential to do serious damage to our earth.

In the energy industry that increased insight will help when averting its own disasters, or ‘killer asteroids’. Both predictive and prescriptive models are particularly useful here, for predicting future outcomes and for prescribing different (better, optimal) outcomes: if enough data are collected from factors such as the environment, devices used, and contextual information such as weather patterns or energy usage, models now know how to set the user parameters to prevent disaster.

On an energy grid, if a bad outcome is upcoming, conditions can be set to prevent machine failure, whether through reducing the operating temperature or speed, or increasing the frequency of on/off cycles.

Digital twins

An exciting proposition for the industrial sector is the digital twin, a full Computer-Aided Design (CAD) model of any device that can be run alongside its original to track behaviour and identify the cause of any failures. In the energy industry, this could be a digital replica of an offshore wind turbine, for example, monitoring power usage, production and efficiencies, and replaying any anomalies to identify their cause.

Crowdsourcing

When I was at NASA, we worked with scientists worldwide to create an online web portal called Zooniverse that presents large data collections to the public, enabling everyone to contribute to scientific discovery in datasets that are too large for the science teams to explore by themselves.

With the mountains of data we had it might take years, even centuries, to look through. But if you put it online and create an interesting enough challenge around that data, people across the world are going to volunteer their time in the name of scientific research.

We had some incredible results from this crowdsourcing mission. A Dutch schoolteacher called Hanny van Arkel discovered a strange green object while she was looking through images, which turned out to be an entirely new type of astronomical object (and is now named after her).

If I was to hypothesize how you could similarly crowdsource data in the energy sector, perhaps you could have people look at data prior to blackouts. There could be a pattern to the outage, or they could identify places where the power stays on during these blackouts – such as schools or grocery stores – which could be pinpointed on an app so people could use them when there are cuts.

Move beyond reporting

Energy industry executives should be interested in big data, because it allows them to look at all aspects of their business. I have conversations with publicly traded companies who only report on an annual or quarterly basis. I understand this is a regulatory requirement, but it seems to me to be only acting in hindsight.

You can’t drive a vehicle by looking in the rear-view mirror. You have to understand what’s coming, and the only way you can do that is by taking in all the information that is available to you: from the child playing on the street beside the road, to the truck two cars ahead.

Big data can deal with hindsight – events that have happened in the past; oversight – events happening now; and foresight – events happening in the future. And prescriptive modelling gives insight into all of these events. At a time where the global energy industry is undergoing huge change, don’t we need that forward-looking view of the rich information embedded within our big data reservoirs?

Summary

Therefore, the energy industry can benefit from these four approaches (prescriptive modelling, digital twinning, crowdsourcing, and moving beyond reporting) as ways to manage the digital disruption and the flood of new data coming from sensors everywhere. Industry leaders used to encourage organizations to adopt certain products or methodologies to help their data analytics move at the speed of business. I believe now that this is not a viable approach. What you really need are solutions that can help your business move at the speed of your data!

———————–

NOTE: This post was originally published at https://www.linkedin.com/pulse/four-ways-harness-big-data-energy-sector-kirk-borne/

Facilitate Proactive Cybersecurity Operations with Big Data Analytics and Machine Intelligence

Digital processes are disrupting and transforming organizations everywhere. Big Data, Machine Learning, AI, and their applications companion, Machine Intelligence, are the soul of this digital revolution. These applications are probably no more essential anywhere else than in cybersecurity operations.

The quantity and complexity of digital network information has skyrocketed in recent years due to the explosion of internet-connected devices, the rise of operational technologies (OT), and the growth of an interconnected global economy (including IOT: the Internet of Things). With exponentially multiplying mountains of human- and machine-generated network data, the ability to extract meaningful signals about potentially nefarious activities, and ultimately deter those activities, has become increasingly complex.

In other domains, such as marketing and e-commerce, businesses have been able to effectively apply data mining to create customer “journeys” in order to predict and recommend content or products to the end-user. However, within cybersecurity operations, the ability to map the journey of an analyst or an adversary is inherently complex due to the dynamic nature of computer networks, the sophistication of adversaries, and the pervasiveness of technical and human factors that expose network vulnerabilities. Despite these challenges, there is hope for making meaningful progress. E-commerce marketing and cyber operations share one significant factor—the primary actor is a human being, whose interests, intents, motivations, and goals often manifest through their actions, behaviors, and other digital breadcrumbs.

For modern cybersecurity operations to be effective, it is necessary for organizations to monitor digital breadcrumbs from diverse data streams to identify strong activity signals. But, it doesn’t stop at monitoring sensors for signals. Our cybersecurity applications must proceed proactively from sensors (data collectors) to signals (big data) to sentinels (pattern detection and recognition, including the identification of early warnings and creation of alerts, through the algorithms of AI and machine learning) to sense-making (insights and action, through machine intelligence).

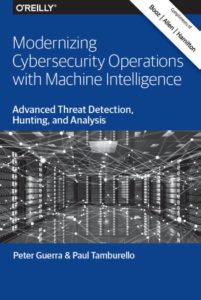
You can learn more about extracting meaningful signals from mountains of data and instrumenting advanced analytics for improved cyber defenses in the new report from Booz Allen Hamilton. Download and read your copy of the free report “Modernizing Cyber Security Operations with Machine Intelligence” here: https://www.oreilly.com/ideas/modernizing-cybersecurity-approaches

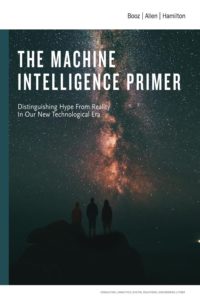
For additional insights into Booz Allen Hamilton’s Machine Intelligence capabilities, and how they can help your organization, download your copy of the “Machine Intelligence Primer” here: http://www.boozallen.com/machineintelligence

Smart Cities at the Nexus of Emerging Data Technologies and You

One of the most significant characteristics of the evolving digital age is the convergence of technologies. That includes information management (databases), data collection (big data), data storage (cloud), data applications (analytics), knowledge discovery (data science), algorithms (machine learning), transparency (open data), computation (distributed computing: e.g., Hadoop), sensors (internet of things: IoT), and API services (microservices, containerization). One more dimension in this pantheon of tech, which is the most important, is the human dimension. We see the human interaction with technology explicitly among the latest developments in digital marketing, behavioral analytics, user experience, customer experience, design thinking, cognitive computing, social analytics, and (last, but not least) citizen science.

Citizen Scientists are trained volunteers who work on authentic science projects with scientific researchers to answer real-world questions and to address real-world challenges (see discussion here). Citizen Science projects are popular in astronomy, medicine, botany, ecology, ocean science, meteorology, zoology, digital humanities, history, and much more. Check out (and participate) in the wonderful universe of projects at the Zooniverse (zooniverse.org) and at scistarter.com.

In the data science community, we have seen activities and projects that are similar to citizen science in that volunteers step forward to use their skills and knowledge to solve real-world problems and to address real-world challenges. Examples of this include Kaggle.com machine learning competitions and the Data Science Bowl (sponsored each year since 2014 by Booz Allen Hamilton, and hosted by Kaggle). These “citizen science” projects are not just for citizens who are untrained in scientific disciplines, but they are dominated by professional and/or deeply skilled data scientists, who volunteer their time and talents to help solve hard data challenges.

The convergence of data technologies is leading to the development of numerous “smart paradigms”, including smart highways, smart farms, smart grid, and smart cities, just to name a few. By combining this technology convergence (data science, IoT, sensors, services, open data) with a difficult societal challenge (air quality in urban areas) in conjunction with community engagement (volunteer citizen scientists, whether professional or non-professional), the U.S. Environmental Protection Agency (EPA) has knitted the complex fabric of smart people, smart technologies, and smart problems into a significant open competition: the EPA Smart City Air Challenge.

The EPA Smart City Air Challenge launched on August 30, 2016. The challenge is open for about 8 weeks. This is an unusually important and rare project that sits at that nexus of IoT, Big Data Analytics, and Citizen Science. It calls upon clever design thinking at the intersection of sensor technologies, open data, data science, environment science, and social good.

Open data is fast becoming a standard for public institutions, encouraging partnerships between governments and their constituents. The EPA Smart City Air Challenge is a great positive step in that direction. By bringing together expertise across a variety of domains, we can hope to address and fix some hard social, environmental, energy, transportation, and sustainability challenges facing the current age. The challenge competition will bring forward best practices for managing big data at the community level. The challenge encourages communities to deploy hundreds of air quality sensors and to make their data public. The resulting data sets will help communities to understand real-time environmental quality, what are the driving factors in air quality change (including geographic features, urban features, and human factors), to assess which changes will lead to better outcomes (including social, mobile, transportation, energy use, education, human health, etc.), and to motivate those changes at the grass roots local community level.

The EPA Smart City Air Challenge encourages local governments to form partnerships with sensor manufacturers, data management companies, citizen scientists, data scientists, and others. Together they’ll create strategies for collecting and using the data. EPA will award prizes of up to $40,000 to two communities based on their strategies, including their plans to share their data management methods so others can benefit. The prizes are intended to be seed money, so the partnerships are essential.

After receiving awards for their partnerships, strategies and designs, the two winning communities will have a year to start developing and implementing their solutions based on those winning designs. After that year, EPA will then evaluate the accomplishments and collaboration of the two winning communities. Based upon that evaluation, EPA may then award up to an additional $10,000 to each of the two winning communities.

The EPA Smart City Air Challenge is open until October 28, 2016. The competition is for developers and scientists, for data lovers and technology lovers, for startups and for established organizations, for society and for you. Join the competition now! For more information, visit the Smart City Air Challenge website at http://www.challenge.gov/challenge/smart-city-air-challenge/, or write to smartcityairchallenge@epa.gov.

Spread the word about EPA’s Smart City Air Challenge — big data, data science, and IoT for societal good in your communities!

Thanks to Ethan McMahon @mcmahoneth for his contributions to this article and to the EPA Smart City Air Challenge.

Follow Kirk Borne on Twitter @KirkDBorne
Discovering and understanding patterns in highly dimensional data

Dimensionality reduction is a critical component of any solution dealing with massive data collections. Being able to sift through a mountain of data efficiently in order to find the key descriptive, predictive, and explanatory features of the collection is a fundamental required capability for coping with the Big Data avalanche. Identifying the most interesting dimensions of data is especially valuable when visualizing high-dimensional (high-variety) big data.

There is a “good news, bad news” angle here. First, the bad news: the human capacity for seeing multiple dimensions is very limited: 3 or 4 dimensions are manageable; 5 or 6 dimensions are possible; but more dimensions are difficult-to-impossible to assimilate. Now for the good news: the human cognitive ability to detect patterns, anomalies, changes, or other “features” in a large complex “scene” surpasses most computer algorithms for speed and effectiveness. In this case, a “scene” refers to any small-n projection of a larger-N parameter space of variables.

In data visualization, a systematic ordered parameter sweep through an ensemble of small-n projections (scenes) is often referred to as a “grand tour”, which allows a human viewer of the visualization sequence to see quickly any patterns or trends or anomalies in the large-N parameter space. Even such “grand tours” can miss salient (explanatory) features of the data, especially when the ratio N/n is large.

Consequently, a data analytics approach that combines the best of both worlds (machine algorithms and human perception) will enable efficient and effective exploration of large high-dimensional data. One such approach is to apply Computer Vision algorithms, which are designed to emulate human perception and cognitive abilities. Another approach is to generate “interestingness metrics” that signal to the data end-user the most interesting and informative features (or combinations of features) in high-dimensional data. A specific example of the latter is latent (hidden) variable discovery.

Latent variables are not explicitly observed but are inferred from the observed features, specifically because they are the variables that deliver the all-important (but sometimes hidden) descriptive, predictive, and explanatory power of the data set. Latent variables can also be concepts that are implicitly represented by the data (e.g., the “sentiment” of the author of a social media posting).  

Because some latent variables are “observable” in the sense that they can be generated through a “yet to be discovered” mathematical combination of several of the measured variables, these are therefore an obvious example of dimension reduction for visual exploration of large high-dimensional data.

Latent (Hidden) Variable Models are used in statistics to infer variables that are not observed but are inferred from the variables that are observed. Latent variables are widely used in social science, psychology, economics, life sciences and machine learning. In machine learning, many problems involve collection of high-dimensional multivariate observations and then hypothesizing a model that explains them. In such models, the role of the latent variables is to represent properties that have not been directly observed.

After inferring the existence of latent variables, the next challenge is to understand them. This can be achieved by exploring their relationship with the observed variables (e.g., using Bayesian methods) . Several correlation measures and dimensionality reduction methods such as PCA can be used to measure those relationships. Since we don’t know in advance what relationships exist between the latent variables and the observed variables, more generalized nonparametric measures like the Maximal Information Coefficient (MIC) can be used.

MIC has become popular recently, to some extent because it provides a straightforward R-squared type of estimate to measure dependency among variables in a high-dimensional data set.  Since we don’t know in advance what a latent variable actually represents, it is not possible to predict the type of relationship that it might possess with the observed variables. Consequently, a nonparametric approach makes sense in the case of large high-dimensional data, for which the interrelationships among the many variables is a mystery. Exploring variables that possess the largest values of MIC can help us to understand the type of relationships that the latent variables have with the existing variables, thereby achieving both dimension reduction and a parameter space in which to conduct visual exploration of high-dimensional data.

The techniques described here can help data end-users to discover and understand data patterns that may lead to interesting insights within their massive data collections.

Follow Kirk Borne on Twitter @KirkDBorne

The Shuttle Challenger Disaster: Reflections and Connections to Data Science

The explosion of the space shuttle Challenger on Jan. 28, 1986, remains one of the worst accidents in the history of the American space program. Two other major fatal space program catastrophes also occurred within a few calendar days of the Shuttle Challenger disaster date: the Apollo 1 fire on January 27, 1967 that killed 3 astronauts, and the Shuttle Columbia disintegration on February 1, 2003 that killed 7 astronauts.

I shared some personal reflections of the Challenger event and its connections to data science in two articles. Here are excerpts from those two publications:

(1) Absence of Evidence is not the same as Evidence of Absence

In the era of big data, we easily forget that we haven’t yet measured everything. Even with the prevalence of data everywhere, we still haven’t collected all possible data on a particular subject. Consequently, statistical analyses should be aware of and make allowances for missing data (absence of evidence), in order to avoid biased conclusions. Conversely, “evidence of absence” is a very valuable piece of information, if you can prove it. Scientists have investigated the importance of these concepts in the evaluation of substance abuse education programs. They find that even though the distinctions between the two concepts (“evidence of absence” versus “absence of evidence “) are important, some policy decisions and societal responses to important problems should move forward anyway. This is an atypical case.

Usually the distinctions between the two concepts (Absence of Evidence versus Evidence of Absence) are significant influencers in decision-making and in the advancement of an area of research.

For example, I once suggested to a major astronomy observatory director that we create a database of things searched for (with his telescopes) but never found – the EAD: Evidence of Absence Database. He liked the idea (as a tool to help minimize redundant usage of his facilities for duplicate false searches in cases where we already have clear evidence of absence), but he didn’t offer to pay for it. Here is one science paper that has dramatically understood this concept: “Can apparent superluminal neutrino speeds be explained as a quantum weak measurement?” The paper’s full complete abstract: “Probably not.”

A more dramatic and ruinous example of a failure to appreciate this statistical concept is the NASA Shuttle Challenger disaster in 1986, when engineers assumed that the lack of evidence of O-ring failures during cold weather launches was equivalent to evidence that there would be no O-ring failure during a cold-weather launch. In this case, the consequences of faulty statistical reasoning were catastrophic. This is an extreme case that clearly demonstrates that “Absence of Evidence is not the same as Evidence of Absence” is an important statistical truism that we must never forget in the era of big data.

(read my full article at http://www.statisticsviews.com/details/feature/4911381/Statistical-Truisms-in-the-Age-of-Big-Data.html)

(2) A Growth Hacker’s Journey – At the right place at the right time

A few months after my arrival at the Hubble Telescope Science Institute in 1985, tragedy struck! In January 1986, the Shuttle Challenger exploded 78 seconds after launch, killing all 7 astronauts on board. As a young person who dreamed of working in astronomy and space sciences since I was 9 years old, I was devastated. It took weeks for the staff to recover from the trauma of that horrific day. To this day, I still get choked up when I watch the recorded video footage of the event. Three things became very clear during those after-months:

  • The Shuttle launches would not resume for several years (hence, the Hubble Telescope would be grounded for all those years) while NASA fixed the problems that led to the Challenger catastrophe, which meant that the Hubble team of scientists and engineers had a lot of years to evaluate and improve all of the telescope systems.
  • One of the systems that was in significant need of improvement was the administrator-oriented Hubble Data Management System, which was previously designed primarily for data management by data system administrators and not designed so much for scientist-friendly data access, exploration, and discovery — hence, during those post-Challenger years, fresh designs and plans were developed for a new “top of the line” scientist-oriented user-friendly Hubble Science Data Archive.
  • Another system was identified as needing total overhaul, even rewriting the entire code base from scratch, and that was the scientific proposal entry, processing, and reporting system — they needed someone new to do the job, someone with a fresh perspective, with database skills, user interface skills, programming skills, and strong familiarity with astronomy. Guess who satisfied all of those constraints?

(read my full article at https://www.mapr.com/blog/growth-hackers-journey-right-place-right-time)

Follow Kirk Borne on Twitter @KirkDBorne
big-hst

Why Today’s Big Data is Not Yesterday’s Big Data — Exponential and Combinatorial Growth

(The following article was first published in July of 2013 at analyticbridge.com. At least 3 of the links in the original article are now obsolete and/or broken. I re-post the article here with the correct links. A lot of things in the Big Data, Data Science, and IoT universe have changed dramatically since that first publication, but I did not edit the article accordingly, in order to preserve the original flavor and context. The central message is still worth repeating today.)

The on-going Big Data media hype stirs up a lot of passionate voices. There are naysayers (“it is nothing new“), doomsayers (“it will disrupt everything”), and soothsayers (e.g., Predictive Analytics experts). The naysayers are most bothersome, in my humble opinion. (Note: I am not talking about skeptics, whom we definitely and desperately need during any period of maximized hype!)

We frequently encounter statements of the “naysayer” variety that tell us that even the ancient Romans had big data.  Okay, I understand that such statements logically follow from one of the standard definitions of big data: data sets that are larger, more complex, and generated more rapidly than your current resources (computational, data management, analytic, and/or human) can handle — whose characteristics correspond to the 3 V’s of Big Data.  This definition of Big Data could be used to describe my first discoveries in a dictionary or my first encounters with an encyclopedia.  But those “data sets” are hardly “Big Data” — they are universally accessible, easily searchable, and completely “manageable” by their handlers. Therefore, they are SMALL DATA, and thus it is a myth to label them as “Big Data”. By contrast, we cannot ignore the overwhelming fact that in today’s real Big Data tsunami, each one of us generates insurmountable collections of data on our own. In addition, the correlations, associations, and links between each person’s digital footprint and all other persons’ digital footprints correspond to an exponential (actually, combinatorial) explosion in additional data products.

Nevertheless, despite all of these clear signs that today’s big data environment is something radically new, that doesn’t stop the naysayers.  With the above standard definition of big data in their quiver, the naysayers are fond of shooting arrows through all of the discussions that would otherwise suggest that big data are changing society, business, science, media, government, retail, medicine, cyber-anything, etc. I believe that this naysayer type of conversation is unproductive, unhelpful, and unscientific. The volume, complexity, and speed of data today are vastly different from anything that we have ever previously experienced, and those facts will be even more emphatic next year, and even more so the following year, and so on.  In every sector of life, business, and government, the data sets are becoming increasingly off-scale and exponentially unmanageable. The 2011 McKinsey report Big Data: The Next Frontier for Innovation, Competition, and Productivity.” made this abundantly clear.  When the Internet of Things and machine-to-machine applications really become established, then the big data V’s of today will seem like child’s play.

In an attempt to illustrate the enormity of scale of today’s (and tomorrow’s) big data, I have discussed the exponential explosion of data in my TedX talk Big Data, small world (e.g., you can fast-forward to my comments on this topic starting approximately at the 9:00 minute mark in the video). You can also read more about this topic in the article Big Data Growth – Compound Interest on Steroids“, where I have elaborated on the compound growth rate of big data — the numbers will blow your mind, and they should blow away the naysayers’ arguments.  Read all about it at http://rocketdatascience.org/?p=204.

Follow Kirk Borne on Twitter @KirkDBorne
 

The Definitive Q&A Guide for Aspiring Data Scientists

I was asked five questions by Alex Woodie of Datanami for his article, “So You Want To Be A Data Scientist”. He used a few snippets from my full set of answers. The longer version of my answers provided additional advice. For aspiring data scientists of all ages, I provide in my article at MapR the full, unabridged version of my answers, which may help you even more to achieve your goal.  Here are Alex’s questions. (Note: I paraphrase the original questions in quotes below.)

1. “What is the number one piece of advice you give to aspiring data scientists?”

2. “What are the most important skills for an aspiring data scientist to acquire?”

3. “Is it better for a person to stay in school and enroll in a graduate program, or is it better to acquire the skills on-the-job?”

4. “For someone who stays in school, do you recommend that they enroll in a program tailored toward data science, or would they get the requisite skills in a ‘hard science’ program such as astrophysics (like you)?”

5. “Do you see advances in analytic packages replacing the need for some of the skills that data scientists have traditionally had, such as programming skills (Python, Java, etc.)?”

Find all of my answers at “The Definitive Q&A for Aspiring Data Scientists“.

Follow Kirk Borne on Twitter @KirkDBorne
Are Your Predictive Models like Broken Clocks?

A wise philosopher (or comedian) once said, “Even a broken clock is right twice a day.” That same statement might also apply to some predictive models. Since prediction is about the future (usually), then random chance (like broken clockwork) may allow our model to be right occasionally (just by accident). The important step in the data science process that aims to reduce the danger of this occurring is the all-important cross-validation phase (or model-testing phase, which uses an independent data set). This phase is devoted to validating that our model works accurately on previously unseen data that were not used in the model training (model-building) phase.

Another way of characterizing this phase can be found in the field of System Engineering: V&V (Verification and Validation). In the first phase (verification), we verify that the system was built correctly (according to a set of requirements and specifications). In the second phase (validation), we validate that we built the correct system (consistent with the operational needs that the end-user, customer, or client expects the system to satisfy). We sometimes say it this way: (1) in verification, we ask “Did we build the system right?”; and (2) in validation, we ask “Did we build the right system?”

Applying the V&V system engineering principle to data science means that we see model-testing as a two-step process. First, we verify that the model is a logical consequent of the input data used to train the model. Second, we validate that the model remains useful, accurate, and robust when applied to previously unseen data. Any data scientist who participates in Kaggle competitions understands and “lives” this process. It is often the case that our first data science model will do a great job on the “seen” data set (i.e., verification by using a “broken clock” that is right on occasion), but the model then performs poorly on the “unseen” data set. A model that does well on both data sets is a winning model (maybe not in every Kaggle competition, but certainly in real-world usage).

Using the same data set both to validate a model and to train the model would be the data science equivalent of “circular reasoning“. This will often lead to “overfitting“, where the initial model is incorrectly trained to reproduce every variation, bump, wiggle, nuance, and noisy deviation in the training data set, thus falsely exaggerating the importance of those fluctuations. “Complexity” describes our world, but it shouldn’t describe our models.

The other extreme in model-building can be just as bad: underfitting (or bias) introduced by using too few explanatory variables to model the behaviors seen in our data set. I like to believe that Albert Einstein understood data science modeling very well when he said “Everything should be made as simple as possible, but not simpler.” Building an excessively complex model (with too many parameters that follow the noise fluctuations in our data) is like putting too much confidence in a broken clock (“it’s exactly right… some of the time!”). George Box warned us to have a little humility in the face of complex data (and a complex world): “All models are wrong, but some are useful.”

Therefore, when faced with highly complex (high-variety) big data, we are also faced with how to choose the “right model”. We should apply the “Goldilocks principle” — choose a model that is not “too good” and not too bad (i.e., the model works well enough on the training data set and on the test data set).

Follow Kirk Borne on Twitter @KirkDBorne
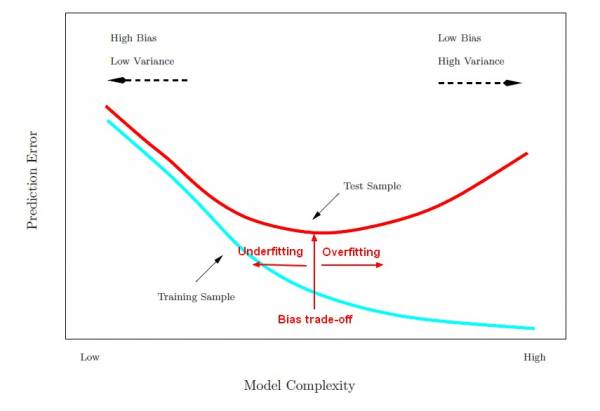
model_complexity_error_training_test


(Source for graphic: http://gerardnico.com/wiki/data_mining/bias_trade-off)