[Note: this post is a slightly modified version of an earlier post. Although written with light (perhaps weak) humor, this post was created to bring attention to the Benefits of Open Data for innovation, value creation, and digital transformation on Open Data Day.]
Data Innovation is a powerful strategic goal for data-intensive organizations, especially to be celebrated through Data Innovation Day events, whenever they may occur. Here are the top 10 conversations that you do not wantto have on that day. Let the countdown begin….
10. CDO (Chief Data Officer) speaking to Data Innovation Day event manager who is trying to re-schedule the event for Father’s Day: “Don’t do that! It’s pronounced ‘Day-tuh’, not ‘Dadda’.”
9. CDO speaking at the company’s Data Innovation Day event regarding an acronym that was used to abbreviate his job title in the event program guide: “I am the company’s Big Data ‘As A Service’ guru, not the company’s Bigdata ‘As Software Service’ guru.” (Hint: that’s BigData-aaS, not Big-aSS)
8. Data Scientist speaking to Data Innovation Day session chairperson: “Why are all of these cowboys on stage with me? I said I was planning to give a LASSO demonstration.”
7. Any person speaking to you: “Our organization has always done big data.”
6. You speaking to any person: “Seriously? … The title of our Data Innovation Day Event is ‘Big Data is just Small Data, Only Bigger’.”
5. New cybersecurity administrator (fresh from college) sends this e-mail to company’s Data Scientists at 4:59pm on Friday: “The security holes in our data-sharing platform are now fixed. It will now automatically block all ports from accepting incoming data access requests between 5:00pm today and 9:00am Monday. Gotta go now. Have a nice weekend. From your new BFF.”
4. Data Scientist speaking to new Human Resources Department Analytics Specialist regarding the truckload of tree seedlings that she received as her end-of-year company bonus: “I said in my employment application that I like Decision Trees, not Deciduous Trees.”
3. Organizer for the huge Las Vegas Data Innovation Day Symposium speaking to the conference keynote speaker: “Oops, sorry. I blew your $100,000 speaker’s honorarium at the poker tables in the Grand Casino.”
2. Over-zealous cleaning crew speaking to the Data Center Manager as she is arriving for work in the morning after Data Innovation Day event that was held in the company’s shiny new Exascale Data Center: “We did a very thorough job cleaning your data center. And we won’t even charge you for the extra hours that we spent wiping the disk drives clean and deleting all the dirty data that you kept talking about yesterday.”
1. Announcement to University staff regarding the Data Innovation Day event: “Dan Ariely’s keynote talk‘Big Data is Like Teenage Sex‘ is being moved from basement room B002 in the Physics Department to the Campus Football Stadium due to overwhelming student interest.”
Definitions of terminology frequently seen and used in discussions of emerging digital technologies.
Additive Manufacturing: see 3D-Printing
AGI (Artificial General Intelligence): The intelligence of a machine that has the capacity to understand or learn any intellectual task that a human being can. It is a primary goal of some artificial intelligence research and a common topic in science fiction and future studies.
AI (Artificial Intelligence): Application of Machine Learning algorithms to robotics and machines (including bots), focused on taking actions based on sensory inputs (data). Examples: (1-3) All those applications shown in the definition of Machine Learning. (4) Credit Card Fraud Alerts. (5) Chatbots (Conversational AI). There is nothing “artificial” about the applications of AI, whose tangible benefits include Accelerated Intelligence, Actionable Intelligence (and Actionable Insights), Adaptable Intelligence, Amplified Intelligence, Applied Intelligence, Assisted Intelligence, and Augmented Intelligence.
Algorithm: A set of rules to follow to solve a problem or to decide on a particular action (e.g., the thermostat in your house, or your car engine alert light, or a disease diagnosis, or the compound interest growth formula, or assigning the final course grade for a student).
Analytics: The products of Machine Learning and Data Science (such as predictive analytics, health analytics, cyber analytics).
AR (Augmented Reality): A technology that superimposes a computer-generated image on a user’s view of the real world, thus providing a composite view. Examples: (1) Retail. (2) Disaster Response. (3) Machine maintenance. (4) Medical procedures. (5) Video games in your real world. (6) Clothes shopping & fitting (seeing the clothes on you without a dressing room). (7) Security (airports, shopping malls, entertainment & sport events).
Autonomous Vehicles: Self-driving (guided without a human), informed by data streaming from many sensors (cameras, radar, LIDAR), and makes decisions and actions based on computer vision algorithms (ML and AI models for people, things, traffic signs,…). Examples: Cars, Trucks, Taxis
BI (Business Intelligence): Technologies, applications and practices for the collection, integration, analysis, and presentation of business information. The purpose of Business Intelligence is to support better business decision-making.
Big Data: An expression that refers to the current era in which nearly everything is now being quantified and tracked (i.e., data-fied). This leads to the collection of data and information on nearly full-population samples of things, instead of “representative subsamples”. There have been many descriptions of the characteristics of “Big Data”, but the three dominant attributes are Volume, Velocity, and Variety — the “3 V’s” concept was first introduced by Doug Laney in 2001 here. Read more in this article: “Why Today’s Big Data is Not Yesterday’s Big Data“. Some consider the 2011 McKinsey & Company research report “Big Data: The Next Frontier for Innovation, Competition, and Productivity” as the trigger point when the world really started paying attention to the the volume and variety of data that organizations everywhere are collecting — the report stated, “The United States alone could face a shortage of 140,000 to 190,000 people with deep analytical skills as well as 1.5 million managers and analysts with the know-how to use the analysis of big data to make effective decisions.”
Blockchain: A system in which a permanent and verifiable record of transactions is maintained across several computers that are linked in a peer-to-peer network. It has many applications beyond its original uses for bitcoin and other cryptocurrencies. Blockchain in an example of Distributed Ledger Technology, in which independent computers (referred to as nodes) record, share and synchronize transactions in their respective electronic ledgers (instead of keeping data centralized as in a traditional ledger). Blockchain’s name refers to a chain (growing list) of records, called blocks, which are linked using cryptography, and are used to record transactions between two parties efficiently and in a verifiable and permanent way. In simplest terms, Blockchain is a distributed database existing on multiple computers at the same time. It grows as new sets of recordings, or ‘blocks’, are added to it, forming a chain. The database is not managed by any particular body; instead, everyone in the network gets a copy of the whole database. Old blocks are preserved forever and new blocks are added to the ledger irreversibly, making it impossible to manipulate by faking documents, transactions and other information. All blocks are encrypted in a special way, so everyone can have access to all the information but only a user who owns a special cryptographic key is able to add a new record to a particular chain.
Chatbots (see also Virtual Assistants): These typically are text-based user interfaces (often customer-facing for organizations) that are designed and programmed to reply to only a certain set of questions or statements. If the question asked is other than the learned set of responses by the customer, the chatbot will fail. Chatbots cannot hold long, continuing human interaction. Traditionally they are text-based but audio and pictures can also be used for interaction. They provide more like an FAQ (Frequently Asked Questions) type of an interaction. They cannot process language inputs generally.
Cloud: The cloud is a metaphor for a global network of remote servers that operates transparently to the user as a single computing ecosystem, commonly associated with Internet-based computing.
Cloud Computing: The practice of using a network of remote servers hosted on the Internet to store, manage, and process data, rather than a local server, local mainframe, or a personal computer.
Computer Vision: An interdisciplinary scientific field that focuses on how computers can be made to gain high-level understanding from digital images or videos. From the perspective of engineering, it seeks to automate tasks that the human visual system can do, including pattern detection, pattern recognition, pattern interpretation, and pattern classification.
Data Mining: Application of Machine Learning algorithms to large data collections, focused on pattern discovery and knowledge discovery in data. Pattern discovery includes clusters (class discovery), correlation (and trend) discovery, link (association) discovery, and anomaly detection (outlier detection, surprise discovery).
Data Science: Application of scientific method to discovery from data (including Statistics, Machine Learning, data visualization, exploratory data analysis, experimentation, and more).
Digital Transformation: Refers to the novel use of digital technology to solve traditional problems. These digital solutions enable — other than efficiency via automation — new types of innovation and creativity, rather than simply enhance and support traditional methods.
Digital Twins: A phrase used to describe a computerized (or digital) version of a real physical asset and/or process. The digital twin contains one or more sensors that collects data to represent real-time information about the physical asset. By bridging the physical and the virtual world, data is transmitted seamlessly allowing the virtual entity to exist simultaneously with the physical entity. Digital Twins are used in manufacturing, large-scale systems (such as maritime vessels, wind farms, space probes) and other complex systems. Digital Twins are virtual replicas of physical devices that data scientists and IT pros can use to run simulations before actual devices are built and deployed, and also while those devices are in operation. They represent a strong merging and optimization of numerous digital technologies such as IoT (IIoT), AI, Machine Learning, and Big Data Analytics.
Drone (UAV, UAS): An unmanned aerial vehicle (UAV) or uncrewed aerial vehicle (commonly known as a Drone) is an aircraft without a human pilot on board. UAVs are a component of an unmanned aircraft system (UAS); which include a UAV, a ground-based controller, and a system of communications between the two.
Dynamic Data-driven Application (Autonomous) Systems (DDDAS): A paradigm in which the computation and instrumentation aspects of an application system are dynamically integrated in a feed-back control loop, such that instrumentation data can be dynamically incorporated into the executing model of the application, and in reverse the executing model can control the instrumentation. Such approaches can enable more accurate and faster modeling and analysis of the characteristics and behaviors of a system and can exploit data in intelligent ways to convert them to new capabilities, including decision support systems with the accuracy of full scale modeling, efficient data collection, management, and data mining. See http://dddas.org/.
Edge Computing (and Edge Analytics): A distributed computing paradigm which brings computation to the data, closer to the location where it is needed, to improve response times in autonomous systems and to save bandwidth. Edge Analytics specifically refers to an approach to data collection and analysis in which an automated analytical computation is performed on data at a sensor, network switch or other device instead of waiting for the data to be sent back to a centralized data store. This is important in applications where the result of the analytic computation is needed as fast as possible (at the point of data collection), such as in autonomous vehicles or in digital manufacturing.
Industry 4.0: A reference to a new phase in the Industrial Revolution that focuses heavily on interconnectivity, automation, Machine Learning, and real-time data. Industry 4.0 is also sometimes referred to as IIoT (Industrial Internet of Things) or Smart Manufacturing, because it joins physical production and operations with smart digital technology, Machine Learning, and Big Data to create a more holistic and better connected ecosystem for companies that focus on manufacturing and supply chain management.
IoT (Internet of Things) and IIoT (Industrial IoT): Sensors embedded on devices and within things everywhere, measuring properties of things, and sharing that data over the Internet (over fast 5G), to fuel ML models and AI applications (including AR and VR) and to inform actions (robotics, autonomous vehicles, etc.). Examples: (1) Wearable health devices (Fitbit). (2) Connected cars. (3) Connected products. (4) Precision farming. (5) Industry 4.0
Knowledge Graphs (see also Linked Data): Knowledge graphs encode knowledge arranged in a network of nodes (entities) and links (edges) rather than tables of rows and columns. The graph can be used to link units of data (the nodes, including concepts and content), with a link (the edge) that explicitly specifies what type of relationship connects the nodes.
Linked Data (see also Knowledge Graphs): A data structure in which data items are interlinked with other data items that enables the entire data set to be more useful through semantic queries. The easiest and most powerful standard designed for Linked Data is RDF (Resource Description Framework).
Machine Learning (ML): Mathematical algorithms that learn from experience (i.e., pattern detection and pattern recognition in data). Examples: (1) Digit detection algorithm (used in automated Zip Code readers at Post Office. (2) Email Spam detection algorithm (used for Spam filtering). (3) Cancer detection algorithm (used in medical imaging diagnosis).
MR (Mixed Reality): Sometimes referred to as hybrid reality, is the merging of real and virtual worlds to produce new environments and visualizations where physical and digital objects co-exist and interact in real time. It means placing new imagery within a real space in such a way that the new imagery is able to interact, to an extent, with what is real in the physical world we know. The key characteristic of MR is that the synthetic content and the real-world content are able to react to each other in real time.
NLP (Natural Language Processing), NLG (NL Generation), NLU (NL Understanding): NLP a subfield of computer science, information engineering, and artificial intelligence concerned with the interactions between computers and human languages, in particular how to program computers to process and analyze large amounts of natural language data. NLG is a software process that transforms structured data into human-language content. It can be used to produce long form content for organizations to automate custom reports, as well as produce custom content for a web or mobile application, or produce the words that will be spoken by a Virtual (Voice-based) Assistant. NLU is a subtopic of Natural Language Processing in Artificial Intelligence that deals with algorithms that have language comprehension (understanding the meaning of the words, both their content and their context).
Quantum Computing: The area of study focused on developing computer technology based on the principles of quantum theory and quantum phenomena (such as superposition of states and entanglement). Qubits are the fundamental units of quantum computing — they are somewhat analogous to bits in a classical computer.
Robotics: A branch of AI concerned with creating devices that can move and react to sensory input (data). Examples: (1) Automated manufacturing assembly line. (2) Roomba (vacuums your house). (3) Warehouse / Logistics. (4) Prosthetics.
Statistics: the practice or science of collecting and analyzing numerical data, especially for the purpose of inferring proportions in a whole population from measurements of those properties within a representative subsample.
UAV (Unmanned Aerial Vehicle) and UAS (Unmanned Aircraft System): see Drones.
Virtual Assistants (see also Chatbots): A sophisticated voice-based interface in an interactive platform for user and customer interactions. Virtual assistants understand not only the language but also the meaning of what the user is saying. They can learn from their conversation instances, which can lead to an unpredictability in their behavior. Consequently, they can have extended adaptable human interaction. They can be set to perform slightly complicated tasks as well, such as order-taking and task fulfillment.
VR (Virtual Reality): Computer-generated simulation of a three-dimensional environment that can be interacted with in a seemingly real or physical way by a person using special electronic equipment, such as a helmet with a screen inside or gloves fitted with sensors. Examples: (1) Games. (2) Family adventures. (3) Training & Education. (4) Design. (5) Big Data Exploration.
XAI (eXplainable AI, Trusted AI): Artificial intelligence that is programmed to describe (explain) its purpose, rationale and decision-making process in a way that can be understood by the average person. This includes the specific criteria the program uses to arrive at a decision.
XPU: One of the many specialized CPUs for specific applications (similar to an ASIC), which may be real-time, data-intensive, data-specific, or at the edge (see Edge Analytics). For more information, refer to the article “Sensor Analytics at Micro Scale on the xPU“.
3D-Printing … moving on to 4D-printing: Additive Manufacturing — the action or process of making a physical object from a three-dimensional digital model, typically by laying down many thin layers of a material in succession. The terms “additive manufacturing” and “3D printing” both refer to creating an object by sequentially adding build material in successive cross-sections, one stacked upon another.
5G: Fifth-generation wireless, the latest iteration of cellular technology, engineered to greatly increase the speed and responsiveness of wireless networks. 5G will also enable a sharp increase in the amount of data transmitted over wireless systems due to more available bandwidth. Example applications: (1) High-definition and 3D video. (2) Gbit/sec Internet. (3) Broadband network access nearly everywhere. (4) IoT.
A few years ago, I generated a list of places to receive data science training. That list has become a bit stale. So, I have updated the list, adding some new opportunities, keeping many of the previous ones, and removing the obsolete ones.
We hear a lot of hype that says organizations should be “Data–first”, or “AI-first, or “Data–driven”, or “Technology–driven”. A better prescription for business success is for our organization to be analytics–driven and thus analytics-first, while being data-informed and technology-empowered. Analytics are the products, the outcomes, and the ROI of our Big Data, Data Science, AI, and Machine Learning investments!
AI strategies and data strategies should therefore focus on outcomes first. Such a focus explicitly induces the corporate messaging, strategy, and culture to be better aligned with what matters the most: business outcomes!
The analytics-first strategy can be referred to as Analytics By Design, which is derived from similar principles in education: Understanding By Design. Analytics are the outcomes of data activities (data science, machine learning, AI) within the organization. So we should keep our eye on the prize — maintaining our focus on the business outcomes (the analytics), which are data-fueled, technology-enabled, and metrics-verified. That’s the essence of Analytics by Design.
The two complementary roles of data — “the yin and the yang” — in which data are collected at the front end (from business activities, customer interactions, marketing reports, and more), while data are also collected at the back end as metrics to verify performance and compliance with stated goals and objectives.
The four principles of Analytics By Design.
The five take-away messages for organizations that have lots of data and that want to win with Analytics By Design.
For data scientists, the message is “Come for the data. Stay for the science!”
Diversity in data is one of the three defining characteristics of big data — high data variety — along with high data volume and high velocity. We discussed the power and value of high-variety data in a previous article: “The Five Important D’s of Big Data Variety” We won’t repeat those lessons here, but we focus specifically on the bias-busting power of high-variety data, which was actually the last of the five D’s mentioned in the earlier article: Decreased model bias.
Here, we broaden our meaning of “bias” to go beyond model bias, which has the technical statistical meaning of “underfitting”, which essentially means that there is more information and structure in the data than our model has captured. In the current context, we apply a broader definition of bias: lacking a neutral viewpoint, or having a viewpoint that is partial. We will call this natural bias, since the examples can be considered as “naturally occurring” without obvious intent. This article does not elaborate on personal bias (which might be intentional), though the cause for that kind of prejudice is essentially the same: not considering and taking into account the full knowledge and understanding of the person or entity that is the subject of the bias.
In that full version of this article, we go on to describe several examples of natural bias and then to present a recommended bias-busting remedy for those of us working in the realm of data science. We refer to that remedy as the CCDI data & analytics strategy: Collect, Curate, Differentiate, and Innovate.
Here is one of the four examples of natural bias that you will find in the longer, complete version of the article:
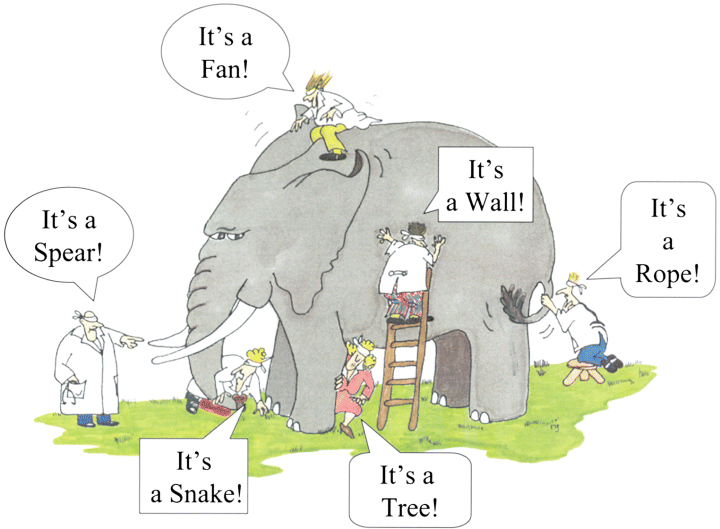
An example of natural bias comes from a famous cartoon. The cartoon shows three or more blind men (or blindfolded men) feeling an elephant. They each feel a different aspect of the elephant: the tail, a tusk, an ear, the body, a leg — and consequently they each offer a different interpretation of what they believe this thing is (which they cannot see). They say it might be a rope (the tail), or a spear (the tusk), or a large fan (the ear), or a wall (the body), or a tree trunk (the leg). Only after the blindfolds are removed (or an explanation is given) do they finally “see” the full truth of this large complex reality. It has many different features, facets, and characteristics. Focusing on only one of those features and insisting that this partial view describes the whole thing would be foolish. We have similar complex systems in our organizations, whether it is the human body (in healthcare), or our population of customers (in marketing), or the Earth (in climate science), or different components in a complex system (like a manufacturing facility), or our students (in a classroom), or whatever. Unless we break down the silos and start sharing our data (insights) about all the dimensions, viewpoints, and perspectives of our complex system, we will consequently be drawn into biased conclusions and actions, and thus miss the key insights that enable us to understand the wonderful complexity and diversity of the thing in its entirety. Integrating the many data sources enables us to arrive at the “single correct view” of the thing: the 360 view!
Collecting high-variety data from diverse sources, connecting the dots, and building the 360 view of our domain is not only the data silo-busting thing to do. It is also the bias-busting thing to do. High-variety data makes that possible, and there is no shortage of biases for high-variety data to bust, including cognitive bias, confirmation bias, salience bias, and sampling bias, just to name a few! …
We often think of analytics on large scales, particularly in the context of large data sets (“Big Data”). However, there is a growing analytics sector that is focused on the smallest scale. That is the scale of digital sensors — driving us into the new era of sensor analytics.
Small scale (i.e., micro scale) is nothing new in the digital realm. After all, the digital world came into existence as a direct consequence of microelectronics and microcircuits. We used to say in the early years of astronomy big data (which is my background) that the same transistor-based logic microcircuitry that comprises our data storage devices (which are storing massive streams of data) is essentially the same transistor-based logic microcircuitry inside our sensors (which are collecting that data). The latter includes, particularly, the sensors inside digital cameras, consisting of megapixels and even gigapixels. Consequently, there should be no surprise that the two digital data functions (sensing and storing) are intimately connected and that we are therefore drowning in oceans of data.
But, in our rush to crown data “big”, we sometimes may have forgotten that micro-scale component to the story. But not any longer. There is growing movement in the microchip world in new and interesting directions.
I am not only talking about evolutions of the CPU (central processing unit) that we have seen for years: the GPU (graphics processing unit) and the FPGA (field programmablegate array). We are now witnessing the design, development, and deployment of more interesting application-specific integrated circuits (ASICs), one of which is the TPU (tensor processing unit) which is specifically designed for AI (artificial intelligence) applications. The TPU (as its name suggests) can perform tensor calculations on the chip, in the same way that earlier generation integrated circuits were designed to perform scalar operations (in the CPU) and to perform vector and/or parallel streaming operations (in the GPU).
Speeding the calculations is precisely the goal of these new chips. One that I heard discussed in the context of cybersecurity applications is the BPU (Behavior Processing Unit), designed to detect BOI (behaviors of interest). Whereas the TPU might be detecting persons of interest (POI) or objects of interest in an image, the BOI is looking at patterns in the time series (sequence data) that are indicative of interesting (and/or anomalous) behavioral patterns.
The BOI detector (the BPU) would definitely represent an amplifier to cybersecurity operations, in which the massive volumes of data streaming through our networks and routers are so huge that we never actually capture (and store) all of that data. So we need to detect the anomalous pattern in real-time before a damaging cyber incident occurs!
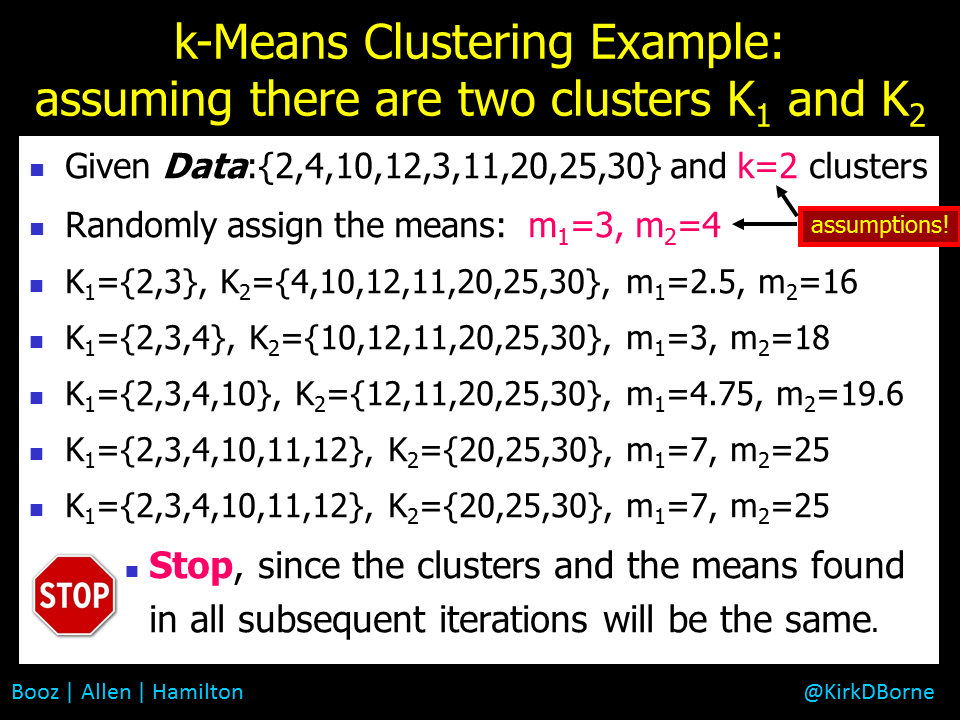
In a related post we discussed the Cold Start Problem in Data Science — how do you start to build a model when you have either no training data or no clear choice of model parameters. An example of a cold start problem is k-Means Clustering, where the number of clusters k in the data set is not known in advance, and the locations of those clusters in feature space (i.e., the cluster means) are not known either. So, you start by assuming a value for k and making random assumptions about the cluster means, and then iterate until you find the optimal set of clusters, based upon some evaluation metric. See the related post for more details about the cold start challenge. See the attached graphic below for a simple demonstration of a k-Means Clustering application.
The above example (clustering) is taken from unsupervised machine learning (where there are no labels on the training data). There are also examples of cold start in supervised machine learning (where you do have class labels on the training data).
As an example of a cold start in supervised learning, we look at neural network models, where the weights on the edges that connect the various nodes in the network layers are not known initially. So, random values (e.g., all weights = 1) are assigned to all of the edge weights (which could number in the hundreds or thousands) — that’s the cold start. Following that, the weights can “learn” to get better through a technique known as backpropagation, which is applied through sequential iterations of the neural network learning process. A validation metric estimates the error in each model iteration in the sequence (i.e., the classification error on the validation or hold-out data set), then applies the backpropagation technique to assign some portion of the error to each of the edge weights. Each edge weight is adjusted accordingly using gradient descent (or some similar error correction rate estimator) for the next model in the sequence. The next iteration of the neural network modeling process is executed, applying the same steps as above, and the process continues until the validation metric converges to the optimal final model.
What is missing in the above discussion is the deeper set of unknowns in the learning process. This is the meta-learning phase. We can elucidate this phase through our two examples above.
From the first example above, k-Means Clustering:
What is the value of k?
Which features in the data set are most effective in creating distinct clusters in the data (i.e., to create the segments that are the most compact internally, and relatively the most separated from each other)? There might be dozens or hundreds or thousands of attributes to choose from, and a vast number of combinations of those attributes in which to explore clustering in different dimensions of parameter space.
What distance metric should be used to estimate separation (or what similarity metric should be used to estimate similarity), since clustering is a distance-based algorithm? There are some common choices for distance and similarity metrics (e.g., cosine similarity, Euclidean distance, Manhattan distance, Mahalanobis distance, Lp-Norm, etc.), but that is just the tip of a vast iceberg — just take a look at the 750-page book “Encyclopedia of Distances“.
What evaluation metric should we use to determine if the clusters are “good enough” or optimal (i.e., the most compact set of clusters relative to the separation of the clusters)? There are several choices for such evaluation metrics: Dunn index, Davies-Bouldin index, C-index, and Silhouette analysis are just a few examples.
We need to decide on all of these parameterizations of the clustering model before the cold start interations on the cluster means can begin.
From the second example above, Neural Network modeling, there are also many different preliminary tasks and parameterizations of the network that need to be decided and acted on before the cold start iterations on the edge weights can begin:
There are still more choices, as shown in the list of 24 neural network adjustments, which includes architecture and hyperparameter tuning.
This now gets to the heart of meta-learning. It is focused on learning the right tasks to perform and on tuning the modeling hyper-parameters. These are the different tasks and “external” parameters that differentiate various instantiations of a specific model within a broader category of models — those tasks and external parameterizations must be explored before you start building, iterating, and validating a specific model’s “internal” parameters. For example:
You can cluster children’s toys in a toy store by color, or by shape, or by electronic vs. non-electronic, or by age-appropriateness, or by functionality, or cluster them by some combination of those features.
You can cluster (segment) your customers by the types of products they buy, or by their geographic location, or by their gender, or by their age, or by the day of week that they prefer to shop, or cluster them by some combination of those many different variables.
You can cluster medical drug treatments by the types of symptoms that they address, or by the medical diagnoses (outcomes) that they attempt to cure, or by their dosage amounts, or cluster them by the side-effects that are caused when different combinations of the drugs are used.
Deciding on the higher-level hyper-parameterizations of your clustering approach before you build the actual models is good data science and good business, no matter whether you are sorting toys, or discovering segments in your customer database, or prescribing different medications to medical patients.
Similar decisions must be made for the neural network example mentioned earlier as well as for numerous other machine learning modeling techniques. Meta-learning is important to make sure that you are aware of and attentive to the many choices of modeling tasks and parameterizations for the models that you are about to train. Meta-learning is also critical for demonstrating (proving) that you built the best (or optimal or most accurate) model, given the higher level characteristics (e.g., parameters, architecture, or input data sources) of the modeling effort:
What is the business case? What outcomes will be actionable?
What data do we have? Which combinations of data have we not explored yet?
What metric will demonstrate that we have achieved the globally optimal model (or approximately the global optimum), versus some locally good model that doesn’t generalize across a larger data set?
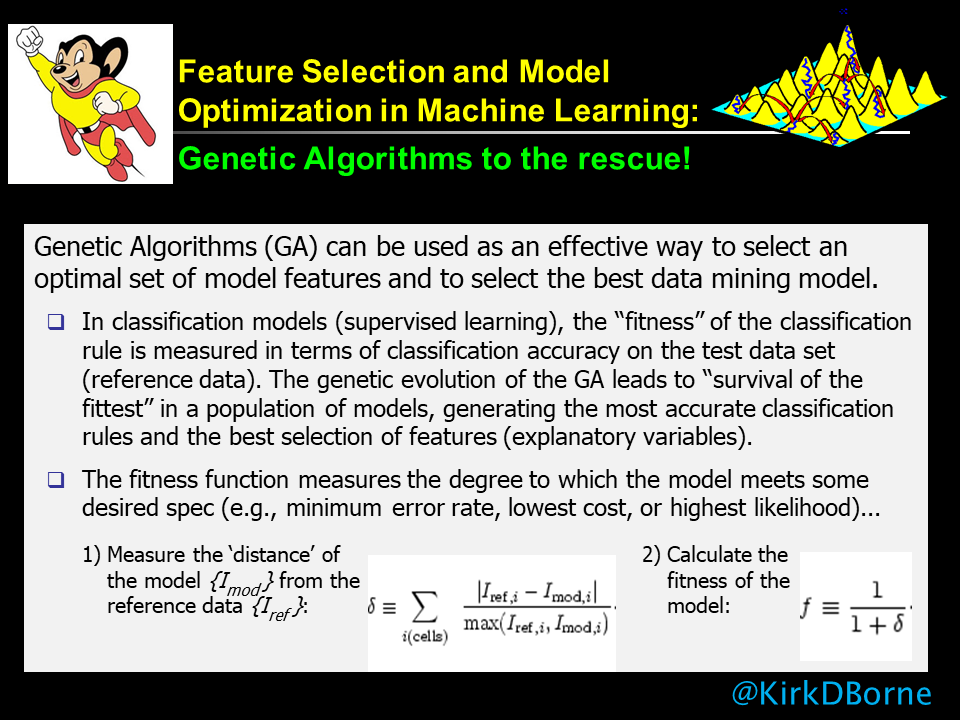
Genetic Algorithms (GAs) are an example of meta-learning. They are not machine learning algorithms in themselves, but GAs can be applied across ensembles of machine learning models and tasks, in order to find the optimal model (perhaps globally optimal model) across a collection of locally optimal solutions.
Learn more about meta-learning from these resources:
The ancient philosopher Confucius has been credited with saying “study your past to know your future.” This wisdom applies not only to life but to machine learning also. Specifically, the availability and application of labeled data (things past) for the labeling of previously unseen data (things future) is fundamental to supervised machine learning.
Without labels (diagnoses, classes, known outcomes) in past data, then how do we make progress in labeling (explaining) future data? This would be a problem.
A related problem also arises in unsupervised machine learning. In these applications, there is no requirement or presumption regarding the existence of labeled training data — we are essentially parameterizing or characterizing the patterns in the data (e.g., the trends, correlations, segments, clusters, associations).
Many unsupervised learning models can converge more readily and be more valuable if we know in advance which parameterizations are best to choose. If we cannot know that (i.e., because it truly is unsupervised learning), then we would like to know at least that our final model is optimal (in some way) in explaining the data.
In both of these applications (supervised and unsupervised machine learning), if we don’t have these initial insights and validation metrics, then how does such model-building get started and get moving towards the optimal solution?
This challenge is known as the cold-start problem! The solution to the problem is easy (sort of): We make a guess — an initial guess! Usually, that would be a totally random guess.
That sounds so… so… random! How do we know whether it’s a good initial guess? How do we progress our model (parameterizations) from that random initial choice? How do we know that our progression is moving towards more accurate models? How? How? How?
This can be a real challenge. Of course nobody said the “cold start” problem would be easy. Anyone who has ever tried to start a very cold car on a frozen morning knows the pain of a cold start challenge. Nothing can be more frustrating on such a morning. But, nothing can be more exhilarating and uplifting on such a morning than that moment when the engine starts and the car begins moving forward with increasing performance.
The experiences for data scientists who face cold-start problems in machine learning can be very similar to those, especially the excitement when our models begin moving forward with increasing performance.
We will itemize several examples at the end. But before we do that, let’s address the objective function. That is the true key that unlocks performance in a cold-start challenge. That’s the magic ingredient in most of the examples that we will list.
The objective function (also known as cost function, or benefit function) provides an objective measure of model performance. It might be as simple as the percentage of class labels that the model got right (in a classification model), or the sum of the squares of the deviations of the points from the model curve (in a regression model), or the compactness of the clusters relative to their separation (in a clustering analysis).
The value of the objective function is not only in its final value (i.e., giving us a quantitative overall model performance rating), but its great (perhaps greatest) value is realized in guiding our progression from the initial random model (cold-start zero point) to that final successful (hopefully, optimal) model. In those intermediate steps it serves as an evaluation (or validation) metric.
By measuring the evaluation metric at step zero (cold-start), then measuring it again after making adjustments to the model parameters, we learn whether our adjustments led to a better performing model or worse performance. We then know whether to continue making model parameter adjustments in the same direction or in the opposite direction. This is called gradient descent.
Gradient descent methods basically find the slope (i.e., the gradient) of the performance error curve as we progress from one model to the next. As we learned in grade school algebra class, we need two points to find the slope of a curve. Therefore, it is only after we have run and evaluated two models that we will have two performance points — the slope of the curve at the latest point then informs our next choice of model parameter adjustments: either (a) keep adjusting in the same direction as the previous step (if the performance error decreased) to continue descending the error curve; or (b) adjust in the opposite direction (if the performance error increased) to turn around and start descending the error curve.
Note that hill-climbing is the opposite of gradient descent, but essentially the same thing. Instead of minimizing error (a cost function), hill-climbing focuses on maximizing accuracy (a benefit function). Again, we measure the slope of the performance curve from two models, then proceed in the direction of better-performing models. In both cases (hill-climbing and gradient descent), we hope to reach an optimal point (maximum accuracy or minimum error), and then declare that to be the best solution. And that is amazing and satisfying when we remember that we started (as a cold-start) with an initial random guess at the solution.
When our machine learning model has many parameters (which could be thousands for a deep neural network), the calculations are more complex (perhaps involving a multi-dimensional gradient calculation, known as a tensor). But the principle is the same: quantitatively discover at each step in the model-building progression which adjustments (size and direction) are needed in each one of the model parameters in order to progress towards the optimal value of the objective function (e.g., minimize errors, maximize accuracy, maximize goodness of fit, maximize precision, minimize false positives, etc.). In deep learning, as in typical neural network models, the method by which those adjustments to the model parameters are estimated (i.e., for each of the edge weights between the network nodes) is called backpropagation. That is still based on gradient descent.
One way to think about gradient descent, backpropagation, and perhaps all machine learning is this: “Machine Learning is the set of mathematical algorithms that learn from experience. Good judgment comes experience. And experience comes from bad judgment.” In our case, the initial guess for our random cold-start model can be considered “bad judgment”, but then experience (i.e., the feedback from validation metrics such as gradient descent) bring “good judgment” (better models) into our model-building workflow.
Here are ten examples of cold-start problems in data science where the algorithms and techniques of machine learning produce the good judgment in model progression toward the optimal solution:
Clustering analysis (such as K-Means Clustering), where the initial cluster means and the number of clusters are not known in advance (and thus are chosen randomly initially), but the compactness of the clusters can be used to evaluate, iterate, and improve the set of clusters in a progression to the final optimum set of clusters (i.e., the most compact and best separated clusters).
Neural networks, where the initial weights on the network edges are assigned randomly (a cold-start), but backpropagation is used to iterate the model to the optimal network (with highest classification performance).
TensorFlow deep learning, which uses the same backpropagation technique of simpler neural networks, but the calculation of the weight adjustments is made across a very high-dimensional parameter space of deep network layers and edge weights using tensors.
Regression, which uses the sum of the squares of the deviations of the points from the model curve in order to find the best-fit curve. In linear regression, there is a closed-form solution (derivable from the linear least-squares technique). The solution for non-linear regression is not typically a closed-form set of mathematical equations, but the minimization of the sum of the squares of deviations still applies — gradient descent can be used in an iterative workflow to find the optimal curve. Note that K-Means Clustering is actually an example of piecewise regression.
Nonconvex optimization, where the objective function has many hills and valleys, so that gradient descent and hill-climbing will typically converge only to a local optimum, not to the global optimum. Techniques like genetic algorithms, particle swarm optimization (when the gradient cannot be calculated), and other evolutionary computing methods are used to generate lots of random (cold-start) models and then iterate each of them until you find the global optimum (or until you run out of time and resources, and then pick the best one that you could find). [See my graphic attached below that illustrates a sample use case for genetic algorithms. See also the NOTE below the graphic about Genetic Algorithms, which also applies to other evolutionary algorithms, indicating that these are not machine learning algorithms specifically, but they are actually meta-learning algorithms]
kNN (k-Nearest Neighbors), which is a supervised learning technique in which the data set itself becomes the model. In other words, the assignment of a new data point to a particular group (which may or may not have a class label or a particular meaning yet) is based simply upon finding which category (group) of existing data points is in the majority when you take a vote of the nearest neighbors to the new data point. The number of nearest neighbors that are to be examined is some number k, which can be initially arbitrary (a cold-start), but then it is adjusted to improve model performance.
Naive Bayes classification, which applies Bayes theorem to a large data set with class labels on the data items, but for which some combinations of attributes and features are not represented in the training data (i.e., a cold-start challenge). By assuming that the different attributes are mutually independent features of the data items, then one can estimate the posterior likelihood for what the class label should be for a new data item with a feature vector (set of attributes) that is not found in the training data. This is sometimes called a Bayes Belief Network (BBN) and is another example of where the data set becomes the model, where the frequency of occurrence of the different attributes individually can inform the expected frequency of occurrence of different combinations of the attributes.
Markov modeling (Belief Networks for Sequences) is an extension of BBN to sequences, which can include web logs, purchase patterns, gene sequences, speech samples, videos, stock prices, or any other temporal or spatial or parametric sequence.
Association rule mining, which searches for co-occurring associations that occur higher than expected from a random sampling of a data set. Association rule mining is yet another example where the data set becomes the model, where no prior knowledge of the associations is known (i.e., a cold-start challenge). This technique is also called Market Basket Analysis, which has been used for simple cold-start customer purchase recommendations, but it also has been used in such exotic use cases as tropical storm (hurricane) intensification prediction.
Social network (link) analysis, where the patterns in the network (e.g., centrality, reach, degrees of separation, density, cliques, etc.) encode knowledge about the network (e.g., most authoritative or influential nodes in the network), through the application of algorithms like PageRank, without any prior knowledge about those patterns (i.e., a cold-start).
Finally, as a bonus, we mention a special case, Recommender Engines, where the cold-start problem is a subject of ongoing research. The research challenge is to find the optimal recommendation for a new customer or for a new product that has not been seen before. Check out these articles related to this challenge:
We started this article mentioning Confucius and his wisdom. Here is another form of wisdom: https://rapidminer.com/wisdom/ — the RapidMiner Wisdom conference. It is a wonderful conference, with many excellent tutorials, use cases, applications, and customer testimonials. I was honored to be the keynote speaker for their 2018 conference in New Orleans, where I spoke about “Clearing the Fog around Data Science and Machine Learning: The Usual Suspects in Some Unusual Places”. You can find my slide presentation here: KirkBorne-RMWisdom2018.pdf
NOTE:Genetic Algorithms (GAs) are an example of meta-learning. They are not machine learning algorithms in themselves, but GAs can be applied across ensembles of machine learning models and tasks, in order to find the optimal model (perhaps globally optimal model) across a collection of locally optimal solutions.
When I was out for a walk recently, I heard a loud low-flying aircraft passing overhead. This was not unusual since we live in the flight path of planes landing at a major international airport about 10 miles from our home. In this case, I thought to myself that the sound seemed more directly overhead and lower than normal as well as being suggestive of a larger than average jet aircraft.
I realized that in my one simple thought, I had made three different inferences from a single stream of data. The data stream was the audible sound of the aircraft. The three inferences were about the altitude (lower than normal), the size (larger than average), and the flight path (more overhead). When I looked up, my tri-inference hypothesis was confirmed. The plane was a very large, low-flying jet for a major overnight shipping company. The slightly unusual flight path may have been associated with the fact that these planes are probably instructed to land on a different runway at the airport than the usual commercial passenger airlines’ flights – consequently, the altitude and location were slightly different from the slightly smaller commercial passenger airlines that pass overhead every day.
This situation caused me to reflect on how often we can jump to conclusions, infer a hypothesis, and (maybe without as much proof as in this case) we assume that our conclusion is true.
For the modern digital organization, the proof of any inference (that drives decisions) should be in the data! Rich and diverse data collections enable more accurate and trustworthy conclusions.
I frequently refer to the era of big data as “the end of demographics”. By that, I mean that we now have many more features, attributes, data sources, and insights into each entity in our domain: people, processes, and products. These multiple data sources enable a “360 view” of the entity, thus empowering a more personalized (even hyper-personalized) understanding of and response to the needs of that unique entity. In “big data language”, we are talking about one of the 3 V’s of big data: big data Variety!
High variety is one of the foundational key features of big data — we now measure many more features, characteristics, and dimensions of insight into nearly everything due to the plethora of data sources, sensors, and signals that we measure, monitor, and mine. Consequently, we no longer need to rely on a limited number of features and attributes when making decisions, taking actions, and generating inferences. We can make better, tailored, more personalized decisions and actions. Every entity is unique! That marks the end of demographics.
Here is another example: suppose that a person goes to their doctor to report problems with painful headaches. That is a single symptom (headache pain) — a single data source, a single signal, a single sensor. However, one could imagine a large number of possible inferences from that one single signal. The headaches could be caused by insufficient sleep (sleep apnea), high blood pressure, pregnancy, or a brain tumor. Obviously, each one of these diagnoses carries a seriously different course of action and treatment.
In “data science language”, what we are describing are different segments (clusters) in the hyperspace of symptoms and causes in which the many causes (clusters) are projected on top of one another (overlap one another) in the symptom space. The way that a data scientist resolves that degeneracy (another data science word) is to introduce more parameters (higher variety data) in order to “look at” those overlapping clusters from different angles and perspectives, thus resolving the different diagnosis clusters. High variety data enables the discovery of multiple clusters, and eventually identifies the correct cluster (correct diagnosis, in this case).
Higher variety data means that we are adding data from other sensors, other signals, other sources, and of different types. Going back to our low-flying airplane example, this has the following application: I not only heard the aircraft (sound = audio data), but I also looked at it (sight = visual data) and I observed its flight path (dynamic change over time = time series data). The proof of my inference about the airplane was in the data! Additional data sources provided the variety of data signals that were needed in order to derive a correct conclusion.
Similarly, when you go to the doctor with that headache, the doctor will start asking about other symptoms (e.g., lack of appetite; or other pains) and may order other medical tests (blood pressure checks, or other lab results). Those additional data sources and sensors provide the variety of data signals that are needed in order to derive the correct diagnosis.
These examples (low-flying aircraft, and headache pain) are representative analogies of a large number of different use cases in every organization, every business, and every process. The more data you have, the better you are able to detect and discover interesting and important phenomena and events. However, the more variety of data you have, the better you are able to correctly diagnose, interpret, understand, gain insights from, and take appropriate action in response to those phenomena and events.
High-variety data is the fuel that powers these insights, because variety is definitely the secret sauce for bigger and better discovery from big data collections.
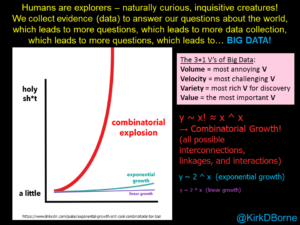
In the early days of the big data era (at the peak of the big data hype), we would often hear about the 3 V’s of big data (Volume, Variety, and Velocity). Then, people started adding more V’s, including Veracity and Value, plus many more! I was guilty of adding several more in my article “Top 10 Big Data Challenges – A Serious Look at 10 Big Data V’s“.
Through the years, I have decided on the following “4 V’s of Big Data” summary in my own presentations:
Volume = the most annoying V
Velocity = the most challenging V
Variety = the most rich V for insights discovery, innovation, and better decisions
Value = the most important V
As Dez Blanchfield once said, “You don’t need a data scientist to tell you big data is valuable. You need one to show its value.”
A series of articles that drive home the all-important value of data is being published on the DataMakesPossible.com site. The site’s domain name says it all: Data Makes Possible!
What does data make possible? I occasionally discuss these things in articles that I write for the MapR blog series, where I have summarized the big data value proposition very simply in my own list of the 3 D2D‘s of big data:
Data-to-Discovery (Class Discovery, Correlation Discovery, Novelty Discovery, Association Discovery)
Data-to-Decisions
Data-to-Dollars (or Data-to-Dividends)
The story is richer and much more impactful these days than those trivial 1-letter (V) or 3-letter (D2D) mnemonics would suggest. We are far past the peak of inflated expectations in the big data hype cycle, and we are even beyond the trough of disillusionment. We have truly entered the plateau of productivity from data in our organizations, though the analytics-driven culture is still going through growing pains.
So, what does data make possible? I document our progress toward deriving big value from big data in a series of articles that I am writing (with more to come) for the DataMakesPossible.com site. These articles include:
But don’t stop there! There are many more fabulous articles, insights, case studies, and impactful stories at DataMakesPossible.com — visit the site often, as there are new posts every week.
Let’s improve our world together through the insights and discoveries that large, comprehensive data collections can provide! That’s what data scientists love to do.